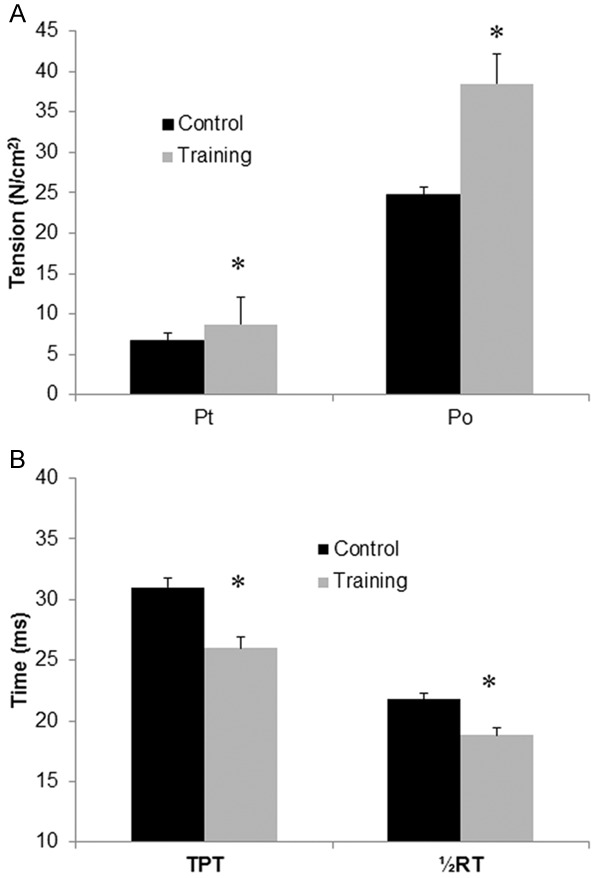
Figure 5.

Expression of twitch and tetanic tension (N/cm2), time to peak tension (TPT) and half-relaxation time (½RT) of diaphragm strips in the rats belonging to the control and training groups 24 h after irradiation. The twitch tension (Pt) was obtained using 1-ms supramaximal square wave pulses, and the tetanic tension (Po) was obtained by applying a train of supramaximal stimuli for 400 ms at optimal length. A. Specific twitch and tetanic tension (N/cm2) of diaphragm strips. B. Time to peak tension (TPT) and half-relaxation time (½RT) of diaphragm strips in the control (black bars) and training (white bars) groups 24 h after irradiation. The data are presented as the means ± SEs. *indicates a significant difference between the two groups (P<0.05).
