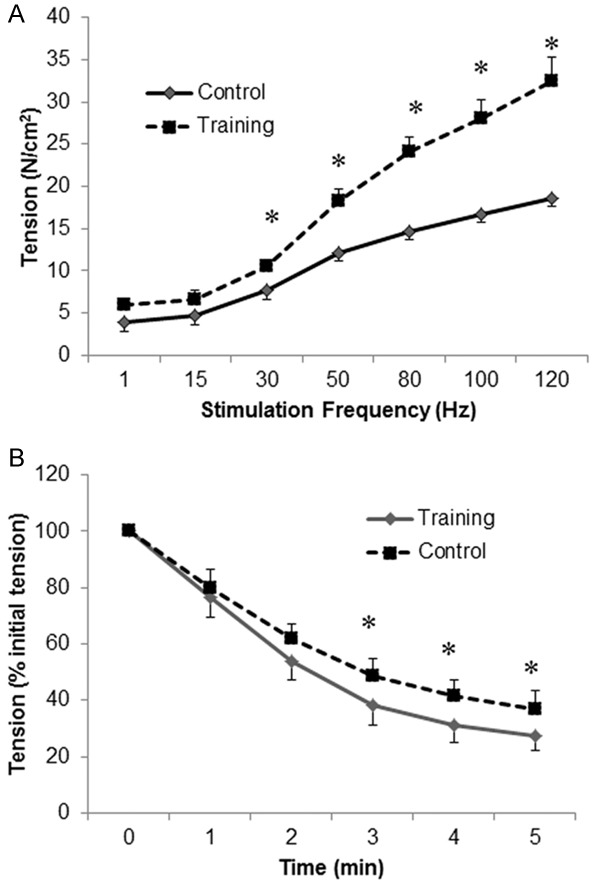
Figure 6.

A force-frequency curve was constructed by stimulating the rats’ strips with trains of supramaximal stimuli at 1, 15, 30, 50, 80, 100 and 120 Hz with a 1-min rest period between adjacent stimulus trains. The fatigue characteristics were measured by giving the muscle a series of 300-ms tetanic stimulations every 3 s at a frequency that was adjusted to produce 50% of Po for 10 min. (A) Diaphragmatic force (N/cm2)-frequency (Hz) curves and (B) mean changes in peak tetanic tension during the repetitive stimulation of diaphragmatic strips of the control (-♦-) and training (--■--) groups 24 h after irradiation. The data are presented as the means ± SEs. *indicates a significant difference between the two groups (P<0.05).
