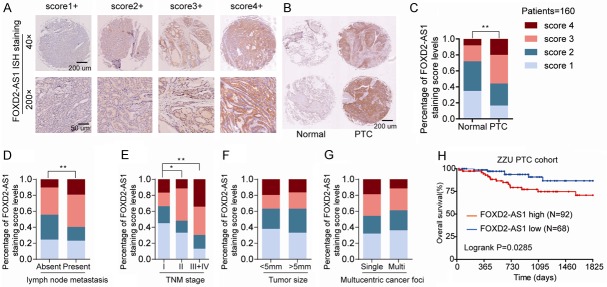
Figure 2.
LncRNA FOXD2-AS1 is markedly upregulated in PTC and positively associated with aggressive phenotypes and poor prognosis. A. Representative FOXD2-AS1 ISH staining patterns with diferent scores in PTC tissues. B, C. Representative photographs of FOXD2-AS1 ISH staining in PTC tissues and normal samples (left) and Distribution of FOXD2-AS1 ISH staining scores distribution in 160 PTC and adjacent normal tissues from tissue microarray. D-G. Distribution of FOXD2-AS1 ISH staining scores in PTC tissues based on lymph node metastasis, TNM classification, tumor size, or multucentric cancer foci. H. Kaplan-Meier survival analysis of the overall survival in 160 PTC patients with different FOXD2-AS1 expression levels. The clinicopathological factors differences between FOXD2-AS1 high or low expression groups were analyzed via Chi-square test. Survival analysis was evaluated using the Kaplan-Meier method and assessed using the log-rank test. *P<0.05 and **P<0.01.

