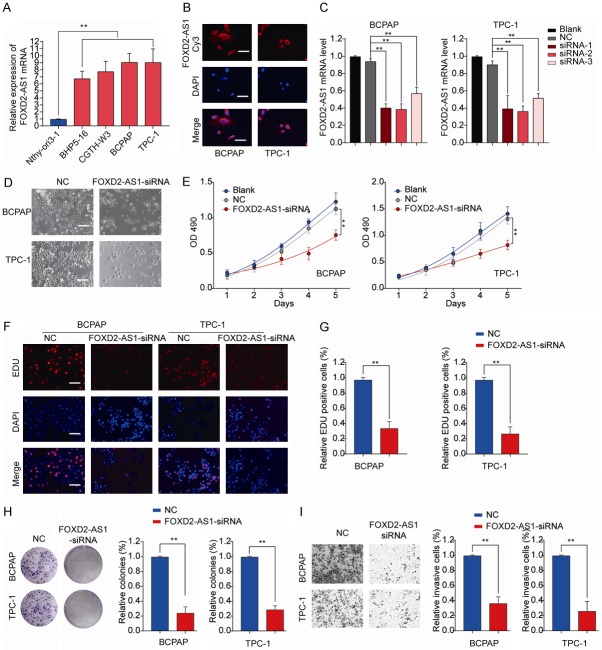
Figure 3.
FOXD2-AS1 knockdown inhibits PTC cell proliferation and invasion in vitro. A. The expression levels of FOXD2-AS1 in normal human thyroid cell line thyroid cell line Nthy-ori3-1 and PTC cell lines (BHP5-16, CGTH-W3, BCPAP and TPC-1) were analyzed by RT-qPCR. B. Representative micrographs of FISH staining showing FOXD2-AS1 (red) and nuclei stained with DAPI (blue) in BCPAP and TPC-1 cells. Scale bars = 50 μm. C. RT-qPCR analysis of FOXD2-AS1 expression in BCPAP or TPC-1 cells, or cells transfected with negative control (NC), FOXD2-AS1 siRNA 1/2/3. D. Representative images of PTC cells transfected with NC or FOXD2-AS1-siRNA in 96-well plate. Scale bars = 50 μm. BCPAP or TPC-1 cells were transfected with NC, FOXD2-AS1-siRNA or left untreated (Blank). E. Cell proliferation of BCPAP or TPC-1 cells was assessed by CCK8 assay at indicated time points. F, G. Cell division of BCPAP or TPC-1 cells was analyzed by EDU staining. Scale bars = 50 μm. H. The colony number of BCPAP or TPC-1 was measured by colony formation assay and counted under a microscope. I. Cell invasion of BCPAP or TPC-1 was analyzed by transwell assay. Data are presented as mean ± SD; Student’s t-test, *P<0.05 and **P<0.01.

