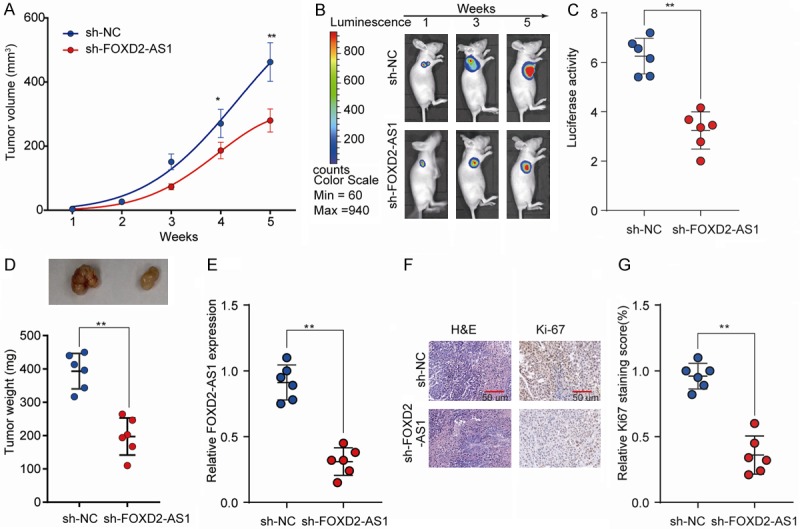
Figure 4.

FOXD2-AS1 knockdown suppresses PTC tumorigenesis in vivo. TPC-1 cells stably knockdown FOXD2-AS1 (sh-FOXD2-AS1) or negative control (sh-NC) were injected subcutaneously into nude mice and tumor growth was monitored. A. Tumor growth curves of sh-FOXD2-AS1 and sh-NC groups were determined based on tumor volume measured every week. B, C. The luciferase activity of PTC tumor in nude mice of sh-FOXD2-As1 or sh-NC group was recorded using a live imaging system detecting the luciferase signal. D. Tumor weights of tumors from sh-FOXD2-AS1 and sh-NC groups were analyzed at week 5. E. Relative FOXD2-AS1 expression in tumor tissues of sh-FOXD2-AS1 or NC group was analyzed by RT-qPCR. F. Representative photographs of H&E and Ki-67 staining of tumor tissues from sh-FOXD2-AS1 or NC group. G. Quantification of relative Ki-67 staining scores in tumor sections from the sh-FOXD2-AS1 or NC group. Data are presented as mean ± SD; Student’s t-test, *P<0.05 and **P<0.01.
