Figure 5.
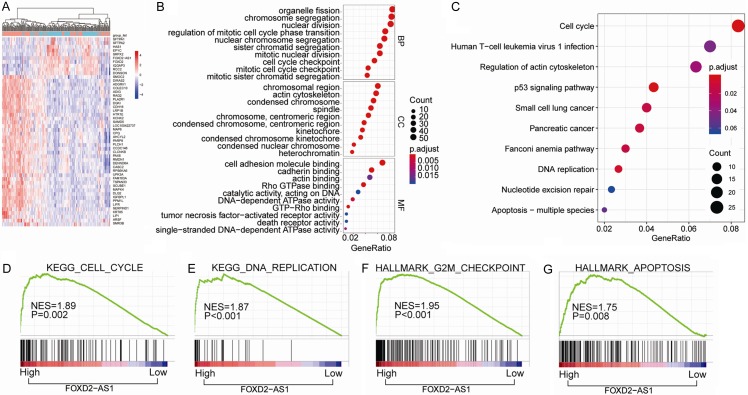
Bioinformatics analysis of key pathways regulated by FOXD2-AS1 in TCGA-THCA cohort. (A) The heatmap of the differential gene expression analysis based on the expression levels of FOXD2-AS1. (B, C) GO enrichment analysis (B) and KEGG pathway enrichment analysis (C) of the top 800 genes with highest FOXD2-AS1 correlation coefficient. (D-G) GSEA analysis of the correlation between FOXD2-AS1 expression with gene signatures of cell cycle (D), DNA replication (E), G2M checkpoint (F) and apoptosis (G) in TCGA-THCA cohort. KEGG pathway enrichment and GO analysis for DEGs were conducted using DAVID (Database for Annotation, Visualization and Integrated Discovery). Pathways with P<0.05 were identified as significance. Gene set enrichment analysis (GSEA) software was acquired from the Broad Institute at MIT. The phenotype labels were generated according to the expression level of FOXD2-AS1. P<0.05 and FDR Q<0.25 were set as the default parameters to generate enrichment results.

