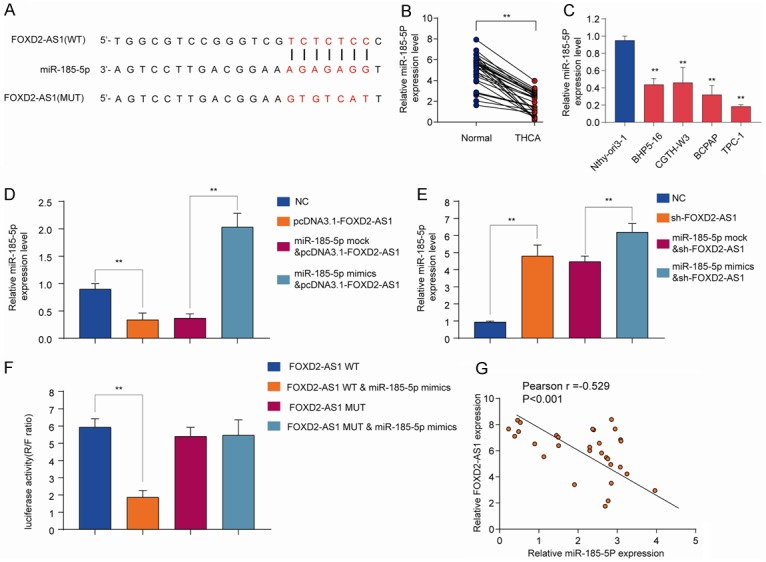
Figure 7.

FOXD2-AS1 directly interacts with miR-185-5p as miRNA sponge. (A) Diagram of the putative binding sites of miR-185-5p on FOXD2-AS1 (WT) and the mutated sequences of FOXD2-AS1 (MUT). (B) The expression levels of miR-185-5p in THCA tissues and normal control tissues were analyzed by qRT-PCR. (C) The expression levels of miR-185-5p in PTC cell lines (BHP5-16, CGTH-W3, BCPAP and TPC-1) and nonmalignant thyroid cell line Nthy-ori3-1 were analyzed by qRT-PCR. (D, E) HEK293 cells were transfected with negative control (NC), pcDNA3.1-FOXD2-AS1, miR-185-5p mock, or miR-185-5p mimics and the expression of miR-185-5p (D) or FOXD2A-AS1 (E) was analyzed by qRT-PCR 48 h later. (F) The WT or mutated FOXD2-AS1 was fused to the luciferase-coding region and co-transfected into HEK293T cells with miR-185-5p mimics. Relative luciferase activity was determined 48 h after transfection. (G) Pearson correlation analysis of FOXD2-AS1 expression and miR-185-5p expression in PTC tissues. Data are presented as mean ± SD; Student’s t-test, *P<0.05 and **P<0.01. Pearson analysis was used to calculate the correlation between the expression of FOXD2-AS1 and miR-185-5p.
