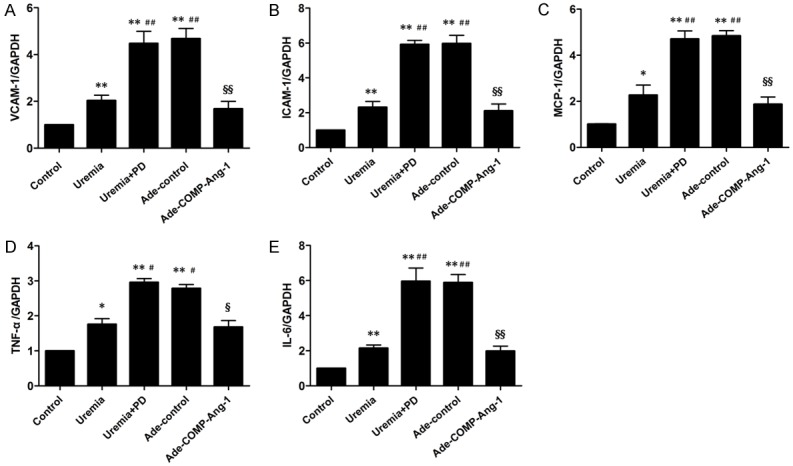
Figure 5.

Expression of peritoneal proinflammatory adhesion molecules and cytokines after COMP-Ang-1 treatment. Semiquantitative analysis of peritoneal VCAM-1 (A), ICAM-1 (B), MCP-1 (C), TNF-α (D) and IL-6 (E) mRNA expression normalized to GAPDH mRNA expression, as measured by real-time PCR. The data are presented as the means ± SDs (n = 6 per group). *P < 0.05 versus the control group; **P < 0.01 versus the control group; #P < 0.05 versus the uremia group; ##P < 0.01 versus the uremia group; §P < 0.05 versus the uremia+PD group; §§P < 0.01 versus the uremia+PD group.
