
Figure 5.
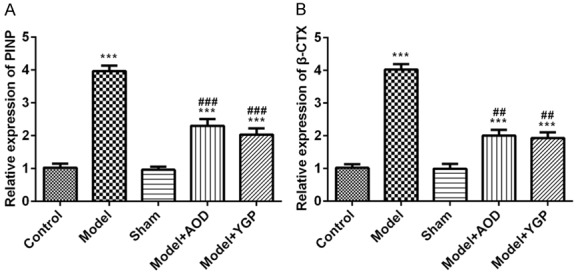
Effects of AOD and YGP on the levels protein PINP and β-CTX in the OVX osteoporosis rats. Each bar represents the mean ± SD calculated from three independent experiments. ***P<0.001 versus sham control. ##P<0.01, ###P<0.001 versus model control.