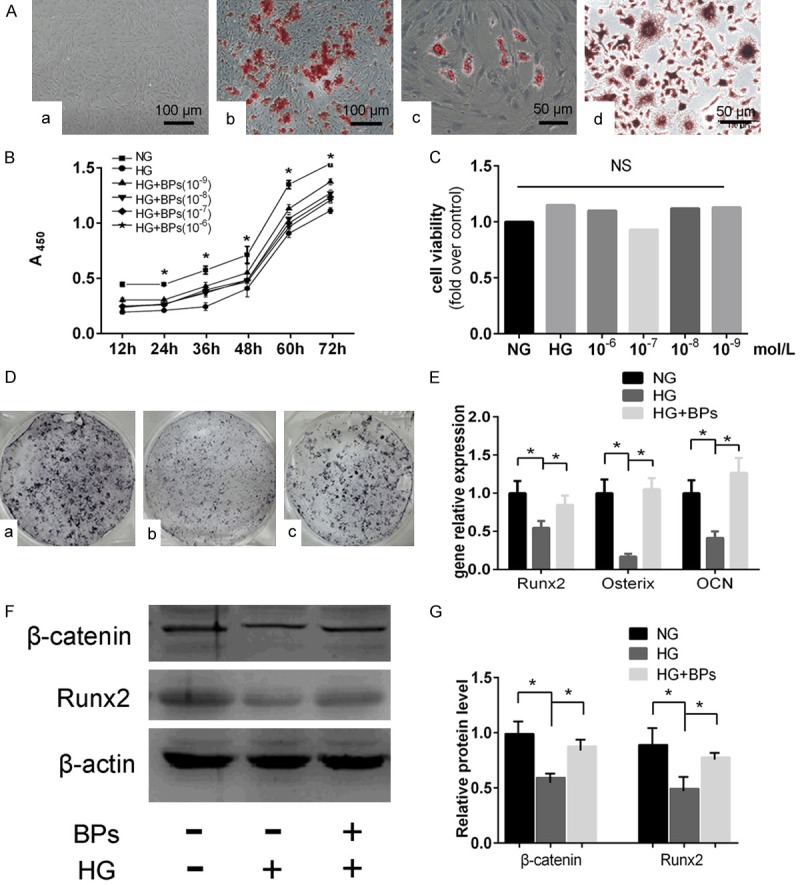
Figure 1.

Cell identification, concentration filtering and osteogenic differentiation of BMSCs in vitro. A, a. An image of cultured BMSCs grown in DMEM (original magnification *200). b. BMSCs differentiated into osteoblasts and stained with Alizarin red (original magnification *200). c. BMSCs differentiated into adipocytes and stained with Oil Red O (original magnification *400). d. BMMS differentiated into osteoclasts and stained with TRAP (original magnification *400). B. Assessment of cell proliferation and filtering of optimal concentration by CCK-8, NG: 5.5 mmol/L glucose, HG: 44 mmol/L glucose, HG+BPs: 44 mmol/L glucose with BPs of 10-6 mol/L, 10-7 mol/L, 10-8 mol/L, and 10-9 mol/L for 12 h, 24 h, 36 h, 48 h, and 72 h). Experiments were performed at least in triplicate, and the data are expressed as the mean ± SD (n=6). C. Assessment of cell viability of high glucose or BPs on osteoclast formation (NG: 5.5 mmol/L glucose, HG: 44 mmol/L glucose, HG+BPs: 44 mmol/L glucose with BPs of 10-6 mol/L, 10-7 mol/L, 10-8 mol/L, and 10-9 mol/L for 48 h culturing). Experiments were performed at least in triplicate, and the data are expressed as the mean ± SD (n=6). D. ALP staining for osteoblastogenesis of BMSCs affected by BPs. a. NG group: 5.5 mmol/L glucose. b. HG group 44 mmol/L glucose. c. HG+BPs: 44 mmol/L glucose + 10-9 mol/L BPs. E. Runx2, OCN and Osterix expression during osteogenesis. Experiments were performed at least in triplicate, and the data are expressed as the mean ± SD (n=3). *P<0.05. (by ANOVA); F, G. Runx2 and β-catenin protein were detected by Western blot. Experiments were performed at least in triplicate. These data are expressed as the mean ± SD (n=3). *P<0.05 (by ANOVA).
