Figure 3.

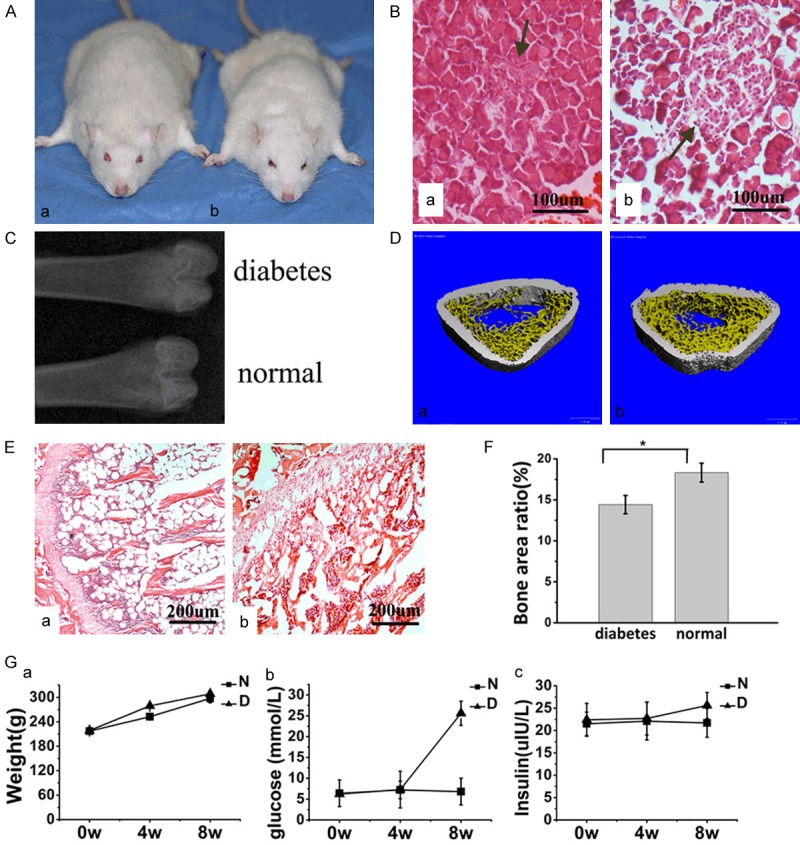
Establishment of type-2 diabetic rat model. A, a. Diabetic rat. b. Normal rat. General morphology of the rats. B, a. Diabetic rat. b. Normal rat. Histological staining of sections of the pancreas (HE staining, original magnification *200). The area of pancreatic islets was markedly reduced, and β-cells appeared to exhibit marked injury in T2DM rats. Decreased bone mass and impaired trabecular microarchitectures were evaluated by X-ray, histological images and micro-CT in T2DM rats. C. X-ray of the proximal femora through the longitudinal plane. D, a. Diabetic rat. b. Normal rat. Micro-CT of the distal femora through the transversal plane. E, a. Diabetic rat. b. Normal rat. Histological sections of the distal femora through the transverse plane (HE staining, original magnification *100). F. Statistical results of BA according to histomorphometry. Experiments were performed in at least triplicate. Data are expressed as the mean ± SD (n=2). *P<0.05 (by ANOVA). Experiments were performed at least in triplicate. G. The changes in body weight, glucose level, and insulin level between the two groups tended to reveal more remarkable changes in glucose levels in the DM group than in the N group. Among the rats after STZ injection, there were no significant differences in body weight or insulin levels between the DM and N groups. Experiments were performed at least in triplicate. The data are expressed as the mean ± SD (n=2). *P<0.05 (by ANOVA).
