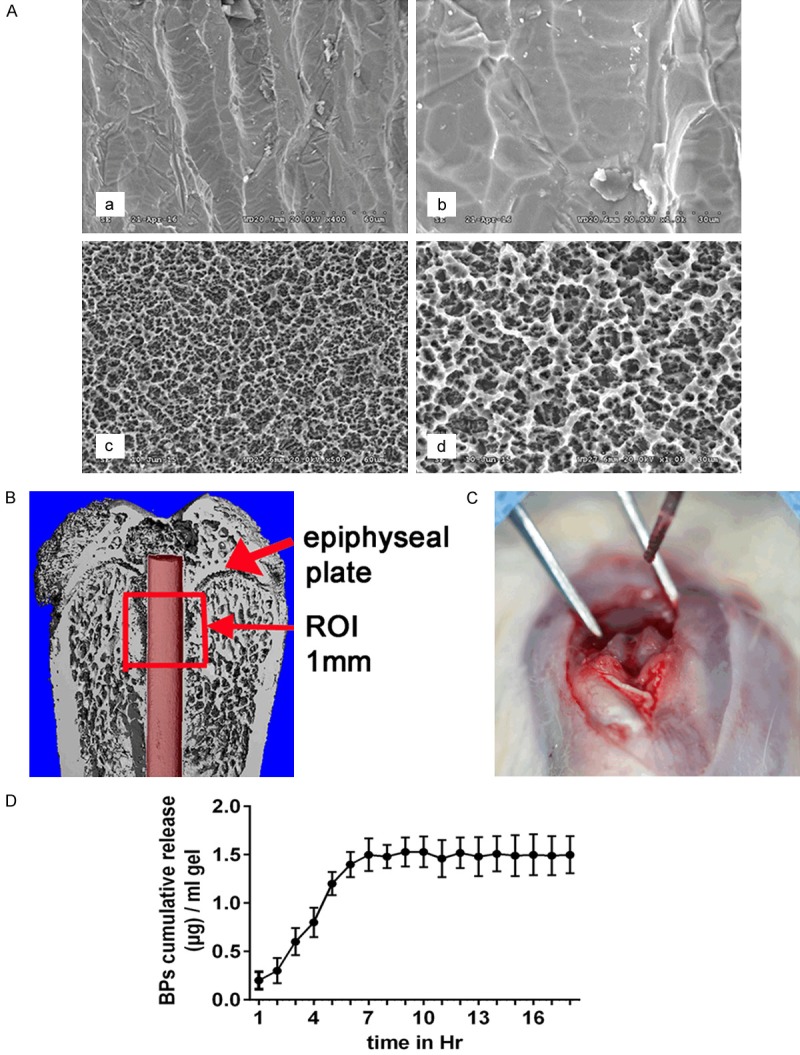
Figure 4.

Implant surgery and the mode of BP release. A. Surface morphology of implants observed using a scanning electron microscope (SEM). a, b. Without grit-blasting and etching. c, d. With grit-blasting and etching). B. Schematic of the region of interest (ROI) in the micro-CT evaluation. The defined ROI was identified as the total trabecular section around the implant with a radius of 500 µm from the first slice to the growth plate and then to the distal 100 slices. C. Prepared implant hole. The implants were inserted into the holes created parallel to the long axis of the femora. D. The cumulative amount of BPs released from 1 mg of crosslinked hyaluronic acid in the gel. The BPs showed relatively rapid release in the first 7 h, continued by a steady release phase.
