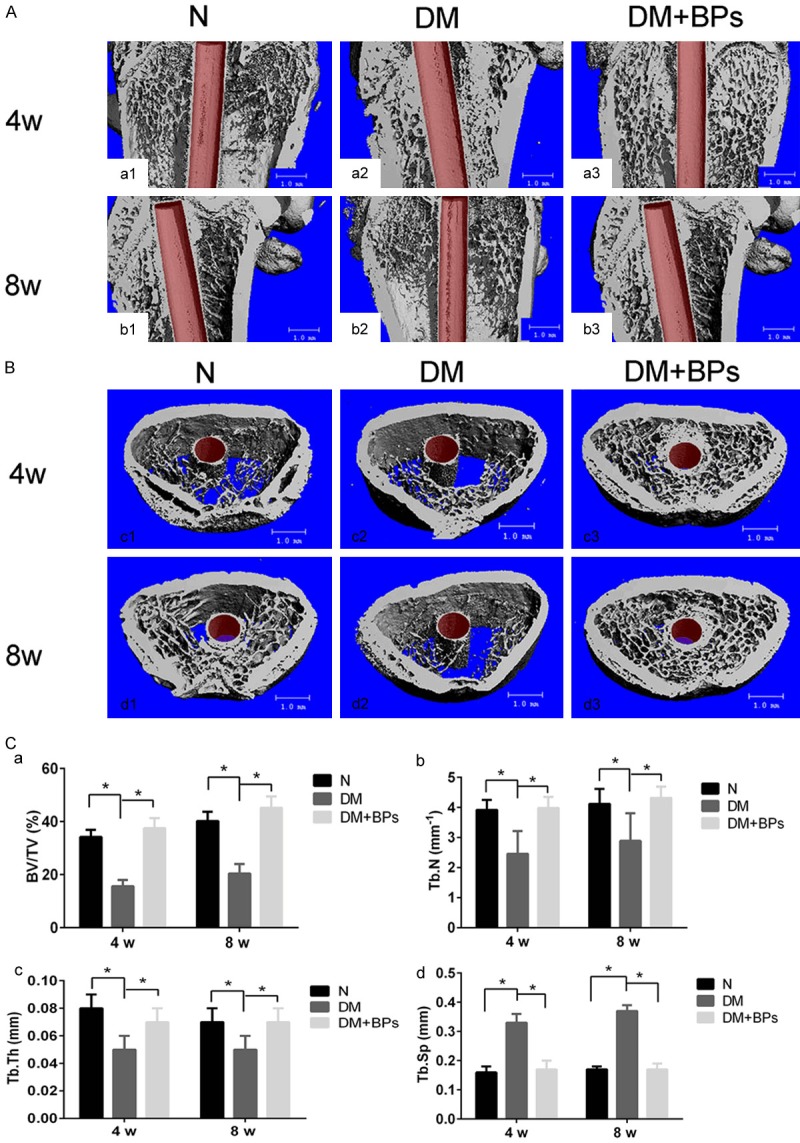
Figure 6.

Micro-CT images of femora with implants. A, B. Micro-CT images of the ROI. The bone-implant interface and the trabecular microstructure of the peri-implant bone tissue among the three groups were analyzed by micro-CT. C. Statistical results of BV/TV, Tb.Th, Tb.N and Tb.Sp according to micro-CT at 4 weeks and 8 weeks after implant insertion in the N, DM and DM+BPs groups, respectively. Experiments were performed at least in triplicate. The data are expressed as the mean ± SD (n=3). *P<0.05 (by ANOVA).
