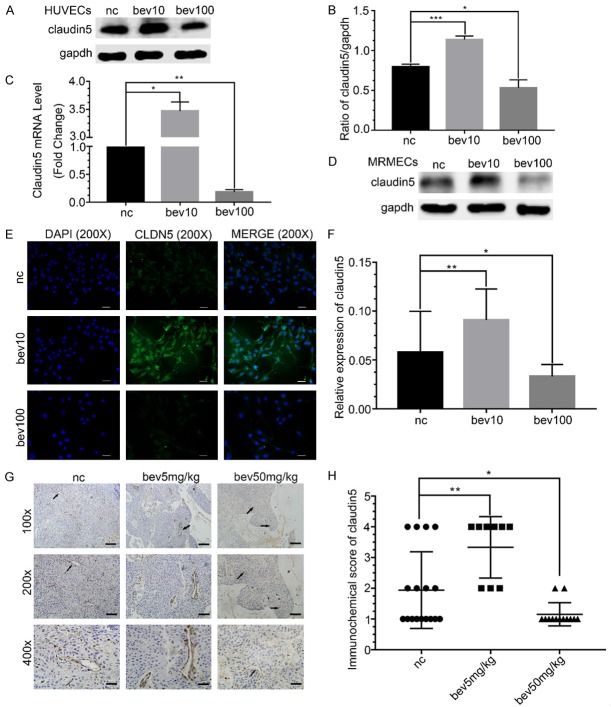
Figure 1.
Effect of different concentrations of bevacizumab on tight junction protein claudin5. A. Western blot showed the change in claudin5 under the different concentrations of bevacizumab (bevacizumab 10 μg/mL, 100 μg/mL) treatment in HUVECs, the results showed that low-dose bevacizumab up-regulated claudin5 but high-dose down-regulated it. B. Quantitative analyses of claudin5 protein levels following bevacizumab treatment. Data represented the mean ± SD, *P < 0.05, ***P < 0.0005; one-way ANOVA. C. Changes of claudin5 mRNA in response to different concentrations of bevacizumab, which were consistent with the western blot. Data represented the mean ± SD, *P < 0.05, **P < 0.005; one-way ANOVA. D. Western blot showed the change in claudin5 under bevacizumab treatment in MRMECs, which were consistent with HUVECs. E. Fluorescence microscopy images of HUVECs treated with different concentrations of bevacizumab. Blue, DAPI; green, claudin5; magnification, × 200; scale bar: 200 μm. F. Quantitative analyses of fluorescence intensities of claudin5 relative expression. Data represented the mean ± SD, *P < 0.05, **P < 0.005; one-way ANOVA. G. Typical images of claudin5 (brown) expression in different groups of adenocarcinoma xenograft tumor model. Black arrows: claudin5. Magnification, row 1: × 100; row 2: × 200; row 3: × 400. Scale bar: 300 μm. H. Scatter diagram showed the immunochemistry score of claudin5 in the adenocarcinoma xenograft tumor. Data represented the mean ± SD, *P < 0.05, **P < 0.005; non-parameter test.

