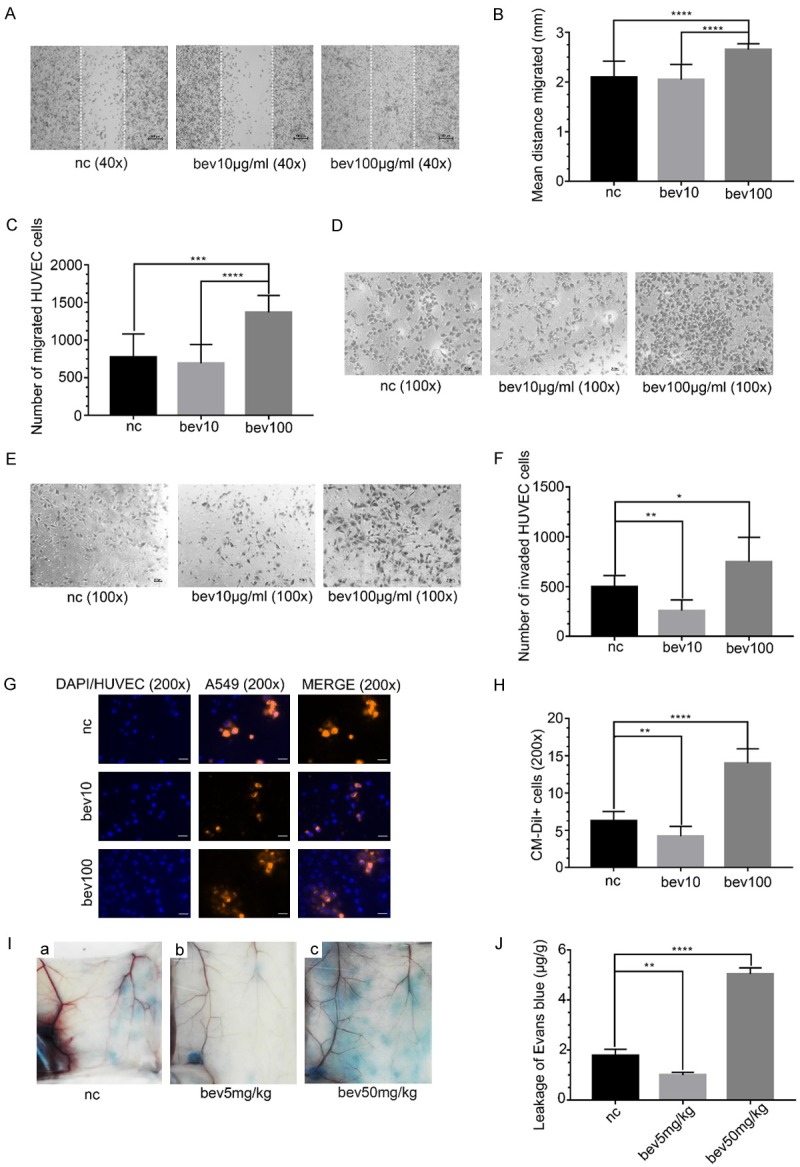
Figure 5.

The abilities of HUVECs in migration, invasion and permeation promoted by high-dose bevacizumab. (A) Microscopic images of wound healing assay of HUVECs treated with bevacizumab (0, 10, 100 μg/mL) for 24 hours. The distance between the dashed lines was the scratch. Magnification: × 40. Scale bar: 100 μm. (B) Quantitative analyses of the distance HUVECs migrated in (A), ****P < 0.0001. The results showed that the migration distance was longer in the high-dose bevacizumab group than the control. (C) Quantitative analyses of the number of HUVECs migrated in (D), ***P < 0.0005, ****P < 0.0001. The results showed that the number of migrated HUVECs was greatest in the high-dose bevacizumab group. (D) Microscopic images of Transwell migration experiment of HUVECs treated with bevacizumab for 6 hours. Magnification: × 100. Scale bar: 100 μm. (E) Microscopic images of Transwell invasion assay of HUVECs treated with bevacizumab for 12 hours. Magnification: × 100. Scale bar: 100 μm. (F) Quantitative analyses of the number of invasive HUVECs in (E), *P < 0.05, **P < 0.0005. The results showed that the number of invasive HUVECs was greatest in the high-dose bevacizumab group. (G) Fluorescence microscopy images of A549 cells across HUVECs in in vitro permeation assay. HUVECs were pre-treated with different concentrations of bevacizumab. Blue, DAPI or HUVECs; orange red, A549 cells. Magnification, × 200. Scale bar: 200 μm. (H) Quantitative analyses of the number of CM-DiI+ cells, i.e., the number of A549 cells, **P < 0.005, ****P < 0.0001. The results showed that the number of A549 cells leaking out through HUVECs was the greatest in the high-dose bevacizumab group. (I) In vivo permeation assay showed the Evans blue leaked from blood vessels of mice. The mice were pretreated with different concentrations of bevacizumab (0, 5, 50 mg/kg) for 14 days. (J) The amount of Evans blue (μg) in the abdominal skin (g) for each group, **P < 0.005, ****P < 0.0001. The results indicated that the Evans blue exudation was highest in the high-dose group. All data were expressed as mean ± SD, and all statistical analyses were performed by one-way ANOVA.
