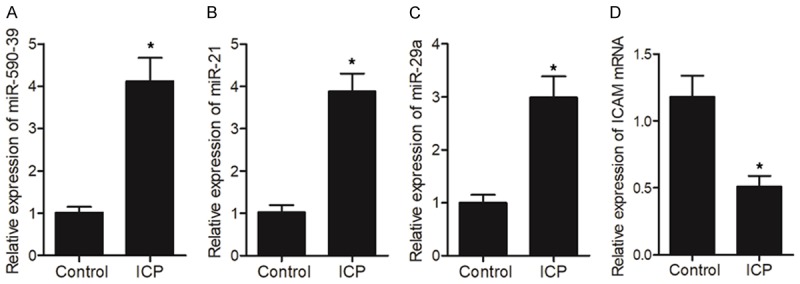
Figure 5.

A negative correlation was observed between ICAM1 mRNA and miR-21/miR-29a/miR-590-3p (*P value < 0.05, vs. control group). A. Expression levels of miR-590-3p in ICP and control groups; B. Expression levels of miR-21 in ICP and control groups; C. Expression levels of miR-29a in ICP and control groups; D. Expression levels of ICAM1 mRNA in ICP and control groups.
