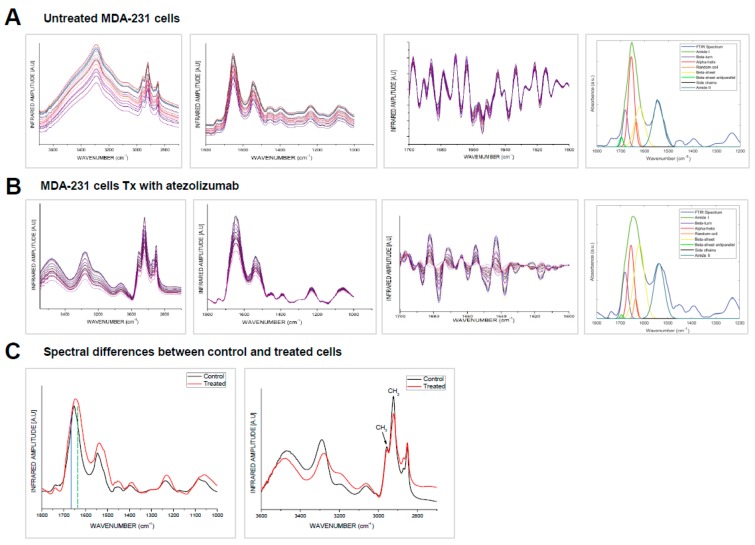
Figure 2.
FTIR analysis of MDA-MB-231 untreated and treated cells with atezolizumab. FTIR analyses were performed on non-treated (NTx) and MDA-MB-231 cells treated (Tx) with atezolizumab after 24 h. Plots show FTIR spectra, second derivative and curve fitting of NTx MDA-MB-231 cells (A) and MDA-MB-231 cells Tx with atezolizumab (B). Plots show spectral differences between NTx and Tx MDA-MB-231 cells (C).

