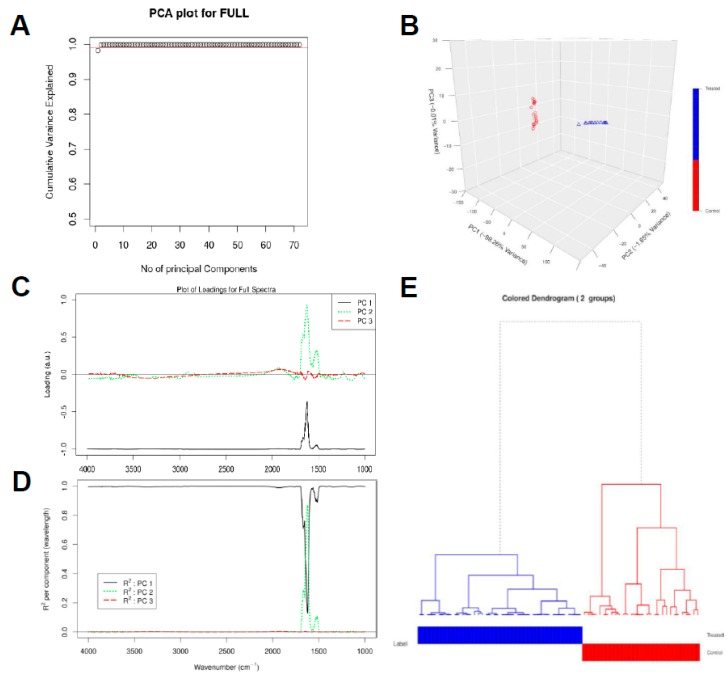
Figure 3.
Chemometric analysis of FTIR experimental data on the full spectral range (4000–1000 cm−1). Amount of variance captured by PCs (A), PCA score plot (B), loading plots for the spectral data (C), squared correlation for the first three PCs for the spectral collection (D), and hierarchical clustering of the spectra for the different experimental samples (E).

