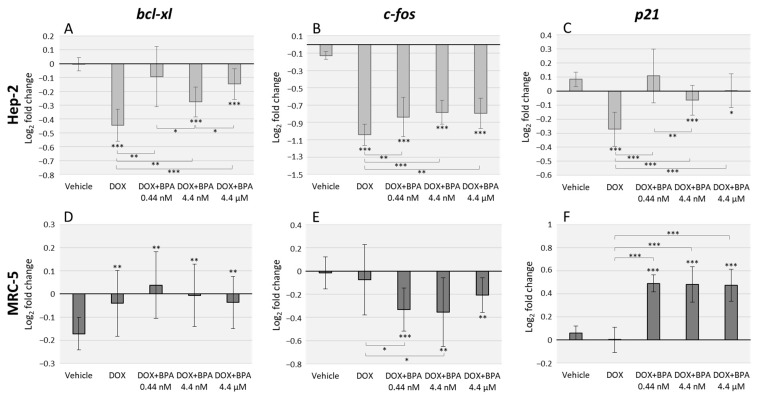
Figure 2.
qRT-PCR analysis in Hep-2 (A–C) and MRC-5 (D–F) cell lines after exposure to doxorubicin (DOX) alone and in combination with three different environmentally relevant concentrations of BPA namely 0.44 nM, 4.4 nM, and 4.4 µM. Data represent the relative expression for the genes: bcl-xl (A,D), c-fos (B,E) and p21 (C,F). GAPDH and β-actin were used for normalization. Error bars represent the standard deviation between two independent treatments and three qRT-PCR replicates. Significant statistical values, which were compared with the vehicle (EtOH) and calculated with Student’s t-test, are illustrated as: * p < 0.05, ** p < 0.01 and *** p < 0.001.

