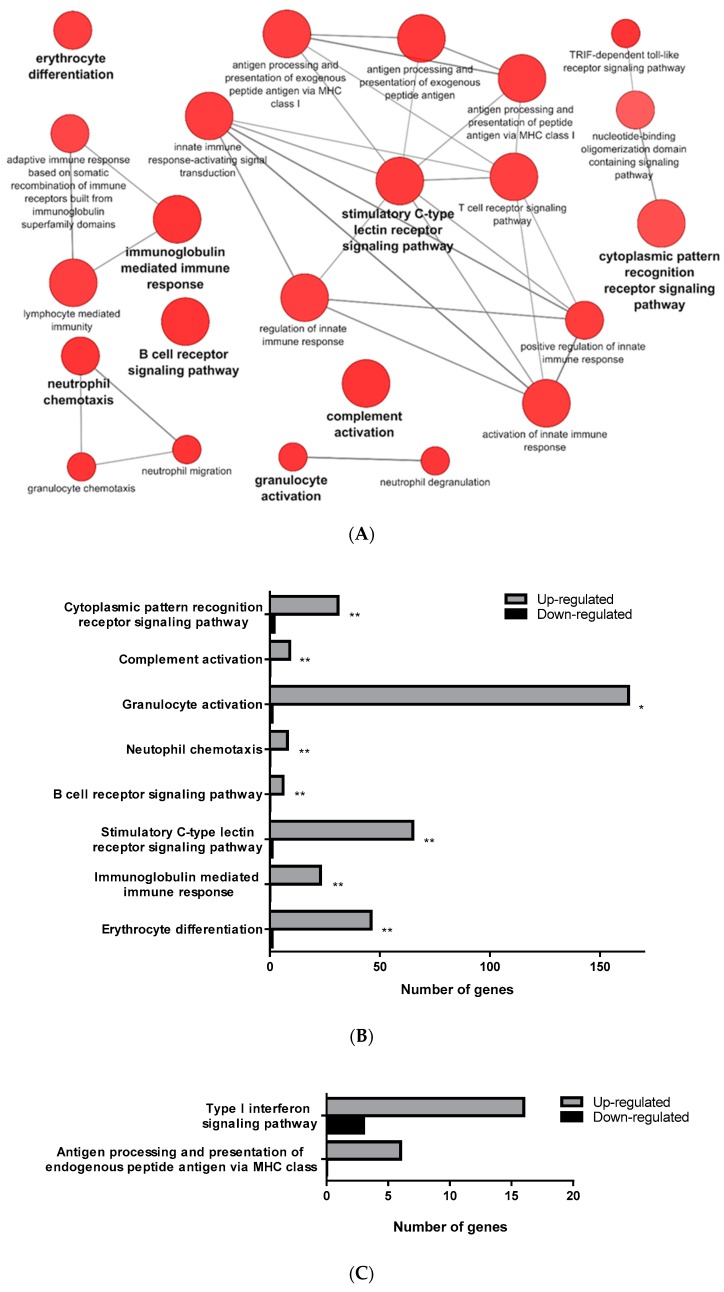
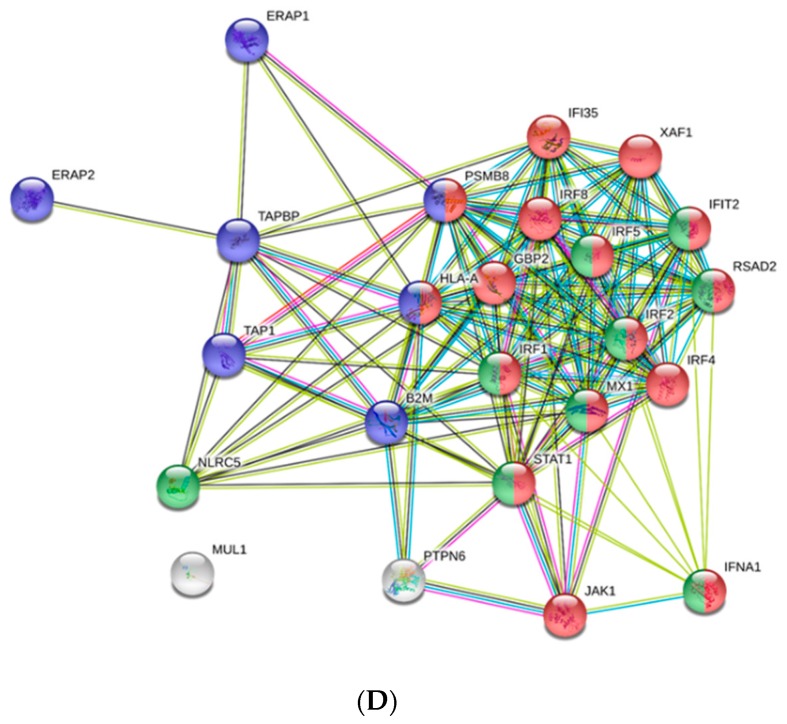
Figure 2.
GO Immune System Process categories overrepresented in the transcriptomic analysis of PB-RBCs and head kidney HK-RBCs from VHSV-challenged rainbow trout. (A) Pathway enrichment network analysis under the GO Immune System Process database from PB-RBCs of VHSV-challenged rainbow trout. Pathway enrichment analysis was performed selecting GO Immune System Process terms with p-value < 0.05, GO Term fusion, and GO Tree interval of 3–8. Red indicates upregulated pathway. (B) The number of upregulated and downregulated genes in each represented GO Immune System Process category from VHSV-challenged rainbow trout PB-RBCs. Asterisks denote GO term significance. (C) Number of upregulated and downregulated genes in each overrepresented GO Immune System Process category from VHSV-challenged rainbow trout HK-RBCs with the following analysis parameters: p-value < 0.1, GO Term fusion, and GO Tree interval of 3–8. (D) Protein–protein interaction (PPI) networks of DEGs identified in the GO Immune System Process terms of HK-RBCs from VHSV-challenged rainbow trout constructed using STRING software (p-value < 10−16). Nodes represent proteins, while edges denote the interactions between two proteins. Different line colors represent the types of evidence used in predicting the associations: Gene fusion (red), gene neighborhood (green), co-expression (black), gene co-occurrence (blue), experimentally determined (purple), from curated databases (teal), text-mining (yellow), or protein homology (lilac). Red nodes denote proteins implicated in the type I interferon signaling pathway (GO:0060337), blue nodes denote proteins implicated in antigen processing and presentation (GO:0019882), and green nodes denote proteins implicated in defense response to virus (GO:0051607).


