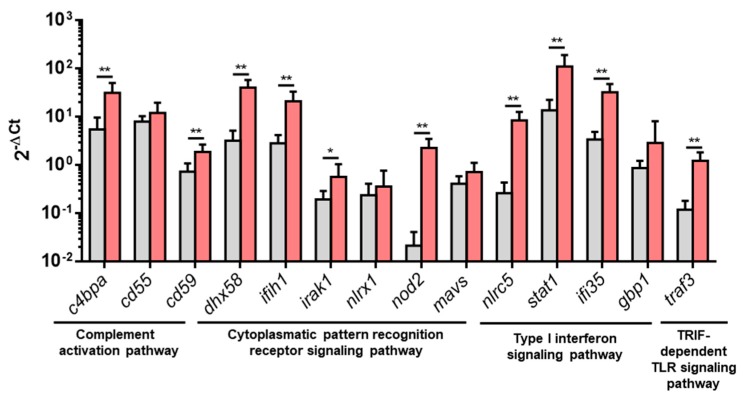
Figure 5.
Upregulated DEGs from overrepresented pathways analyzed by RT-qPCR. Gene expression of PB-RBCs from VHSV-challenged rainbow trout (red bars) compared to the control, mock-challenged fish (gray bars) at 2 dpc. Data represent mean ± SD (n = 6). A Mann–Whitney test was performed to test statistical significance between PB-RBCs from both groups. Asterisks denote statistical significance. * p-value < 0.05; ** p-value < 0.01.

