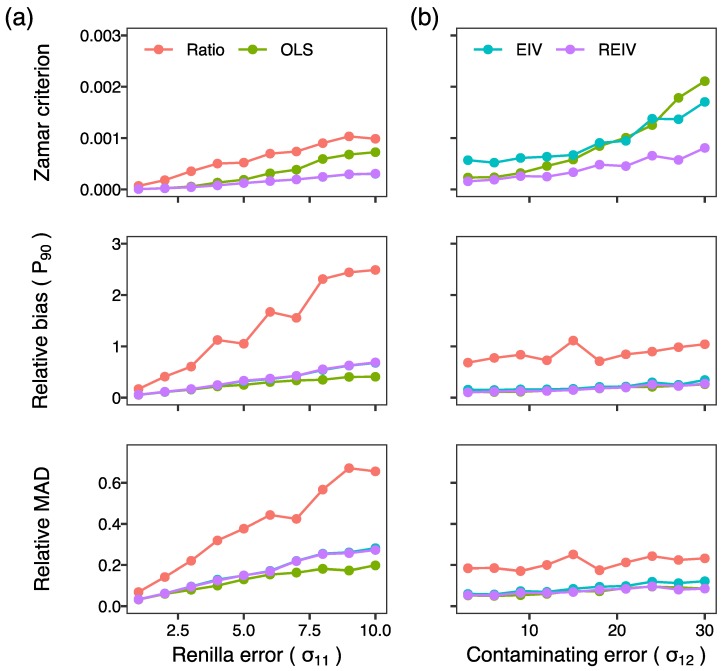
Figure 3.
Tests of normalization methods on simulated data. The top panels plot the Zamar criterion, which is 0 for perfect inference of the true activity. The middle panels plot the 90th percentile () of the relative bias. The bottom panels plot the relative median absolute deviation, a measure of precision. (a) Performance of the methods plotted against standard deviation of the error in Renilla luminescence. Mean transfection efficiency: . True activity: . Sample size: . There were no outliers: . Firefly errors were scaled with activity: (b). Performance plotted against increasing severity of outliers. The standard deviation of the contaminating Renilla errors was varied to simulate outliers. True activity: . Renilla errors: . Firefly errors: . The standard deviation of firefly contaminating errors was scaled with activity: . The other parameters are the same as in panel (a). The Zamar criterion of the ratiometric method was greater than the upper limit of the y-axis.

