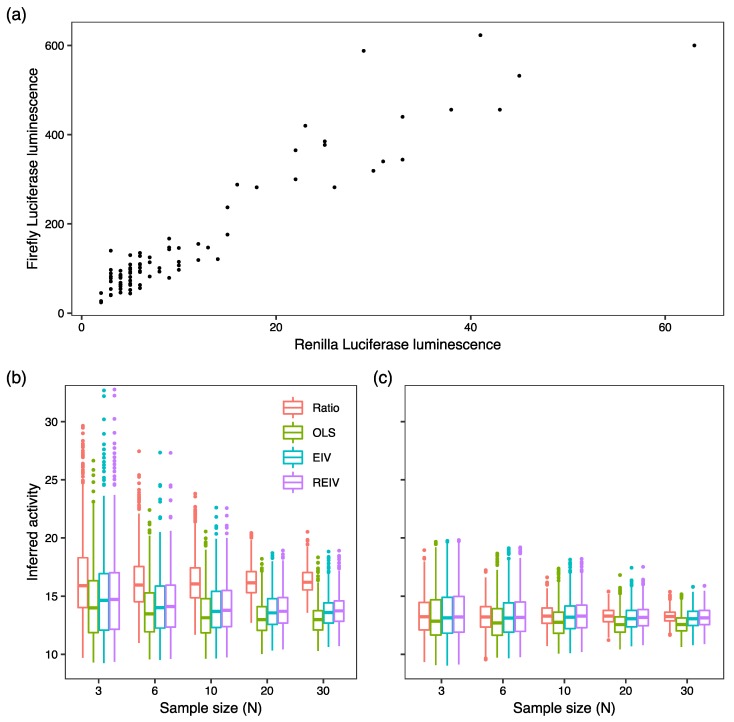
Figure 4.
Tests of normalization methods on empirical data. (a) Dataset of firefly luminescence driven by the Cebpa promoter and Renilla luminescence driven by the CMV promoter in PUER cells. . The dataset was sampled 1000 times with varying sample sizes. Promoter activity was estimated with each method from the same exact data. (b) Boxplots of the inferred activities. The box lines are the first quartile, median, and the third quartile. The whiskers extend to the most extreme values lying within 1.5 times the interquartile range, and any datapoints outside the whiskers are shown as circles. (c) Datapoints having Renilla luminescence 8 RLU or less were excluded from the analysis.

