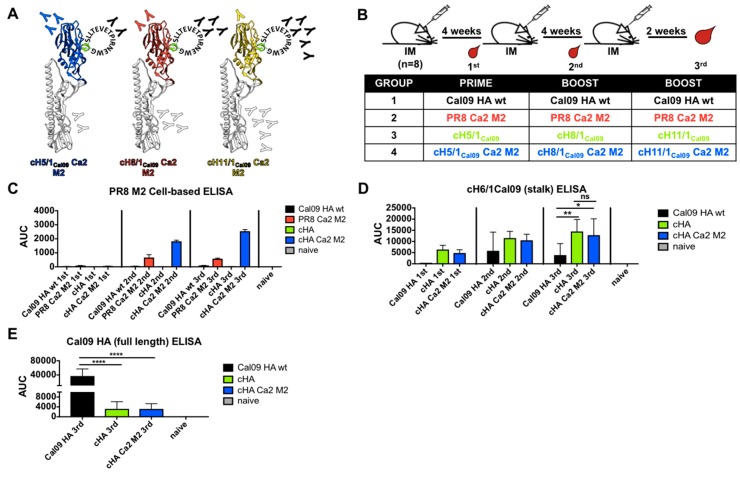
Figure 4.
Antibody responses induced by sequential vaccination of cHA Ca2 M2 viruses. (A) Illustration of the cHA Ca2 M2 hemagglutinins. The same M2e epitope was inserted into the putative Ca2 antigenic site of cH5/1Cal09, cH8/1Cal09 and cH11/1Cal09 (blue: H5 head; red: H8 head; yellow: H11 head; white: Cal09 HA stalk; green: putative Ca2 antigenic site; black: the M2e epitope; “Y”: expected antibody responses). (B) Vaccination regimen and groups. Mice were given 10 µg inactivated purified virus intramuscularly per mouse using a prime-boost-boost vaccination regimen in 4-week intervals. Mice were bled pre-boosts and 2 weeks after the last boost, designated 1st, 2nd and 3rd immunization respectively. Four groups of mice were included (n = 8), the WT Cal09 HA group, the PR8 Ca2 M2 group, the cHA group and the cHA Ca2 M2 group. (C) Cell-based ELISAs using MDCK cells stably expressing the PR8 M2 protein were performed to measure the progression of M2e-specific antibody responses induced by each immunization (pooled sera). (D and E) ELISAs using recombinant proteins were performed to measure (D) the progression of stalk-specific antibody responses and (E) total antibody responses to the full length Cal09 HA after the third immunization. Area under the curve (AUC) was used as the readout of the ELISAs. Statistical difference was determined using one-way ANOVA corrected for multiple comparisons using Dunnett’s test (ns, not significant; *, p < 0.05; **, p < 0.01; ***, p < 0.001; ****, p < 0.0001).

