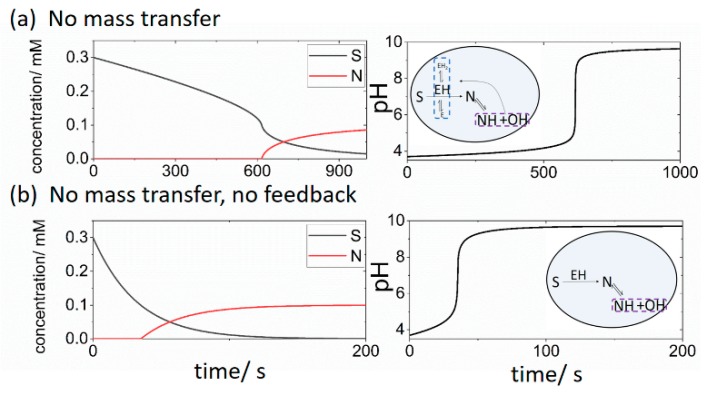
Figure 2.
Changes in concentrations of substrate S and product N (left) and pH (right) in a closed cell with the initial [S] = 0.3 mM, [BH + B] = 0 mM, pH = 3.7, ki = 0 and (a) with feedback (pH dependent R1) (b) without feedback (pH independent R1). Insets illustrate processes considered in the cell model.

