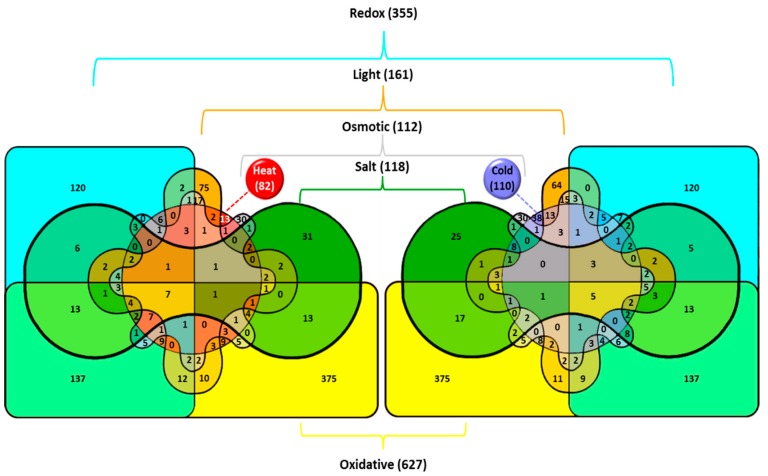
Figure 1.
Venn diagrams illustrating the effects of various stresses on the induction of gene transcription in the cyanobacterium Synechocystis. Total number of genes upregulated in particular stress is shown in parentheses. The number of genes induced by the particular stress or by several stress types is shown without parentheses. Venn diagrams were generated with InteractiVenn at http://www.interactivenn.net. Reproduced from [5] with permission.

