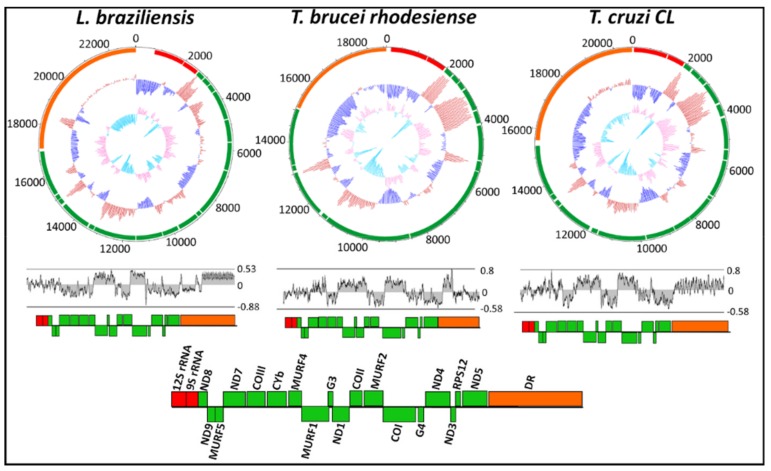
Figure 2.
Circular confirmation of GC plot and GC skew of the maxicircle kinetoplast for Leishmania braziliensis, Trypanosoma brucei rhodesiense and Trypanosoma cruzi. The outer ring indicates gene arrangement and gene distribution. The middle circle represents the GC plot showing GC% content (dark blue for below-average and red for above-average) and the inner circle represents the GC skew (light blue for positive and orange for negative). The AT skew and corresponding gene arrangement and distribution of each species is shown below the circular plot.

