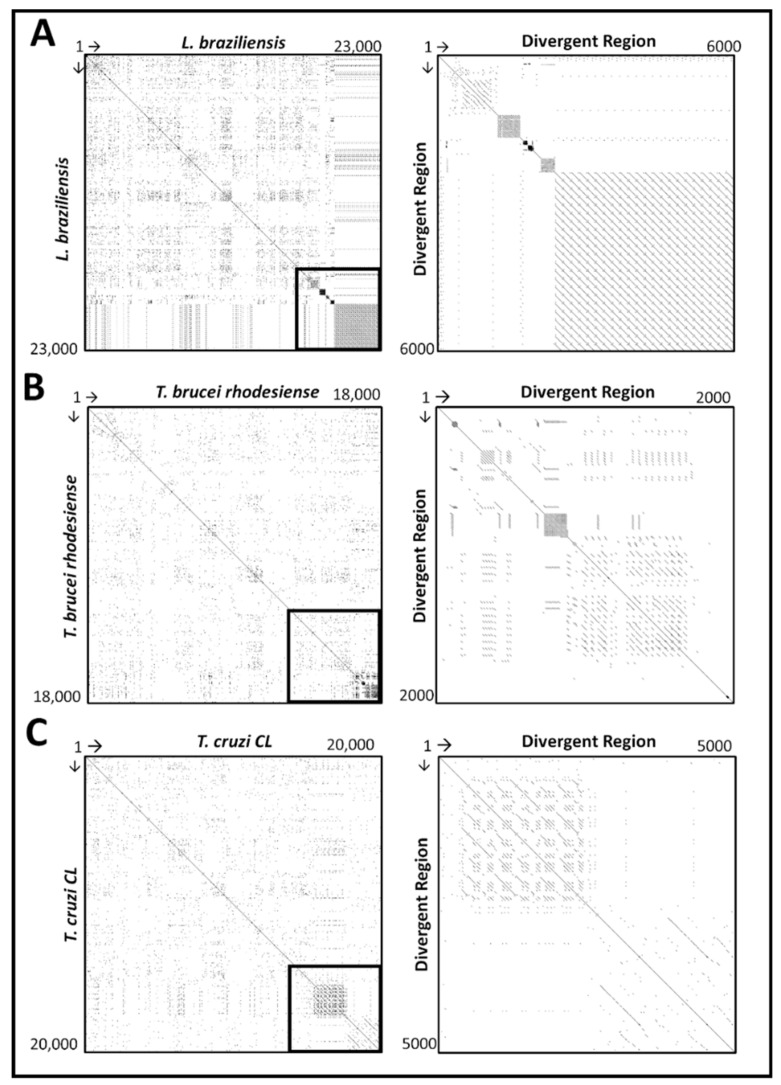
Figure 3.
Self Dottup plot comparative analysis of the entire maxicircle genome (right panel) and divergent region (left panel) of Leishmania braziliensis (A), Trypanosoma brucei rhodesiense (B) and Trypanosoma cruzi (C) against their own sequences. The sequence of each species is placed on the axis and full identity over a 10 bp-long window is represented by a dot. The main diagonal line represents the sequence’s alignment with itself and the lines about the main diagonal represent repetitive patterns within the maxicircle sequence.

