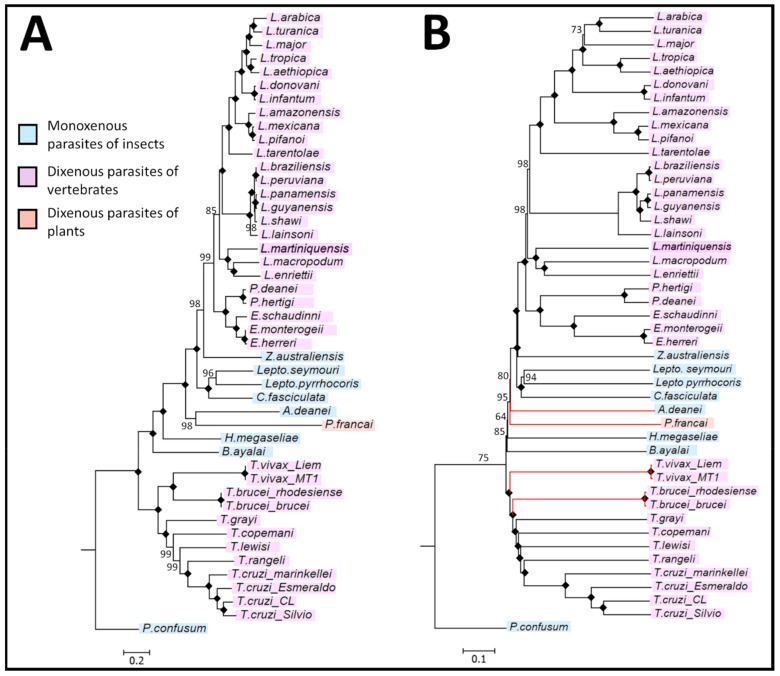
Figure 5.
Inferred evolutionary relationships between species of the trypanosomatid family using aligned and alignment-free analysis of the maxicircle coding region. (A) PhyML-derived phylogeny showing the relationships between members of the trypanosomatid family using a multiple sequence alignment analysis. The maximum likelihood optimality criterion was used for the phylogenetic inference of the dataset with 1000 bootstrap samples. (B) Featue frequency profiles (FPP)-estimated phylogeny between species of the trypanosomatid family using an alignment-free analysis of the maxicircle coding region. Branches in red represent species whose clustering differs from those in (A). In both (A) and (B) a black diamond highlights a node that obtained a bootstrap value of 100% confidence and the scale bars depict the number of nucleotide substitutions per position.

