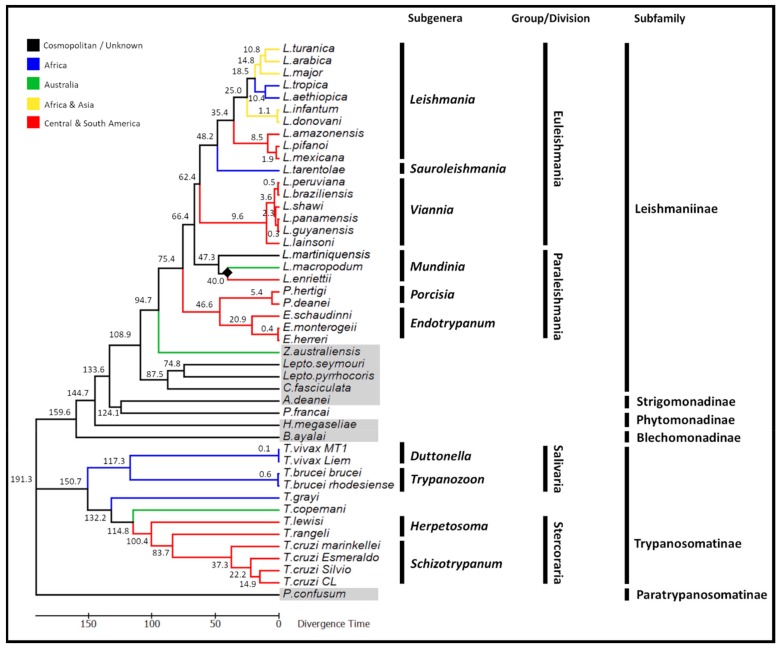
Figure 6.
Phylogenetic time tree demonstrating the complex evolutionary relationships of the trypanosomatid family using the coding region of the maxicircle kDNA. The maximum likelihood of this tree was inferred using the GTR model. The time tree was calculated using a single calibration date, illustrated by a solid black diamond (the separation of Leishmania macropodum and Leishmania enriettii approximately 40 million years ago). Predicted divergence times of the various species are displayed on the nodes of the tree. Monoxenous trypanosomatid species are highlighted in grey.

