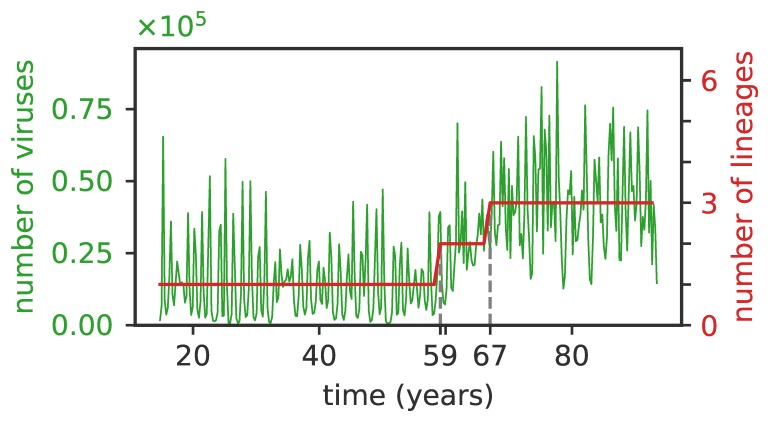
Figure 5.
The average number of viruses is proportional to the number of independent clusters. The total number of viruses (green curve) and of lineages (red curve) as a function of time for , , . The initial single lineage splits into two lineages at years and then into three lineages at years (dashed vertical lines), and the number of viruses first doubles and then triples following the lineage splittings.

