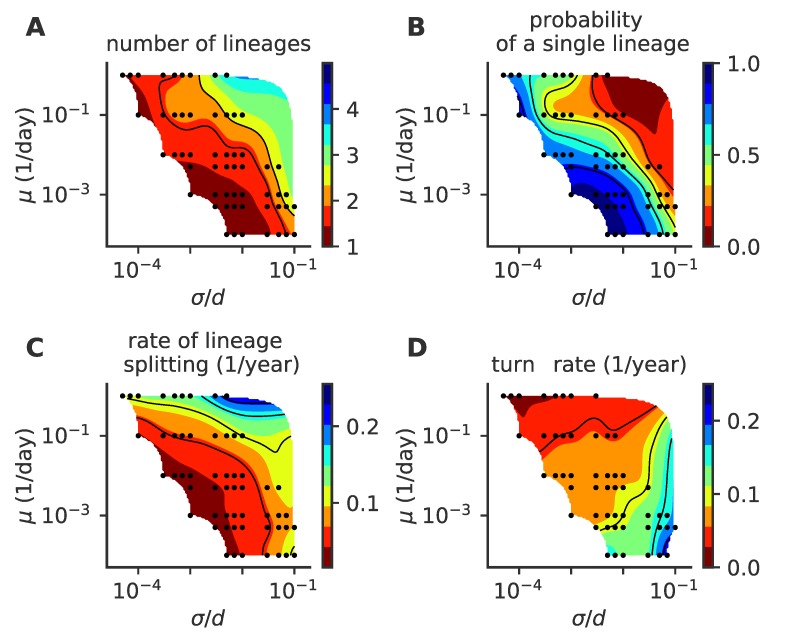
Figure 9.
Phase diagram for the detailed intra-host mutation model. As a function of the mutation rate and mutation jump size , we plot (A) the mean number of co-existing lineages, (B) the fraction of time with one lineage, (C) the lineage splitting rate and (D) the lineage turn rate. In these simulations, viral population size is not constrained, and . For each parameter point, we simulated 100 independent realizations.

