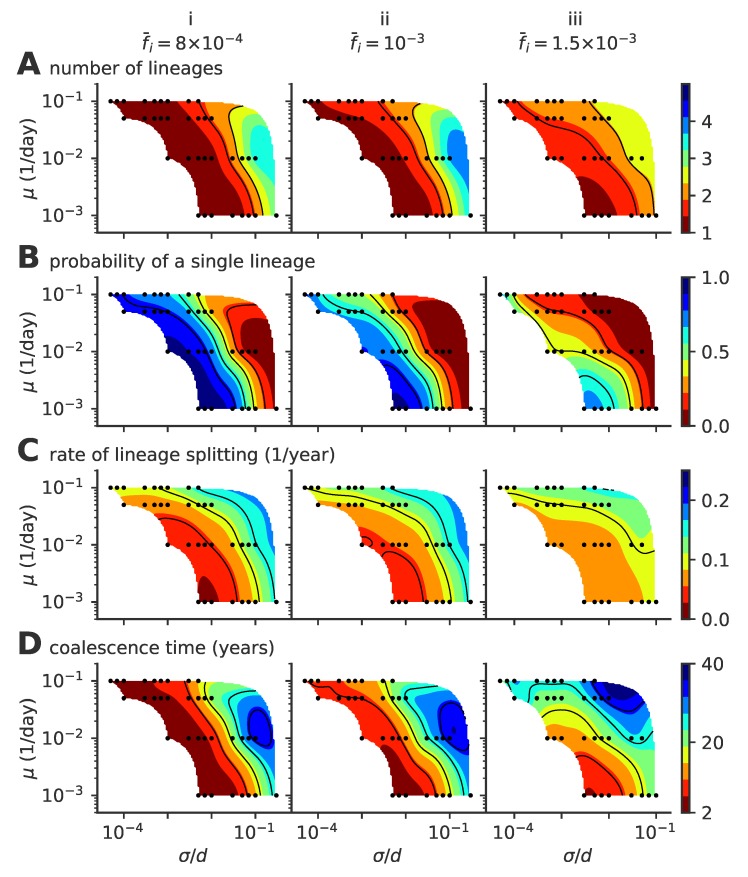
Figure A1.
Phase diagram for a fixed population size of the single- to multiple lineage transition, as a function of mutation rate and mutation jump size . The figure is similar to the one presented in the main text in Figure 4 but assuming a fixed fraction of infected hosts , , and (from left to right, panels i to iii). (A) average number of lineages, (B) fraction of time where viruses are organized in a single lineage, (C) rate of lineage splitting, and (D) the average coalescence time.

