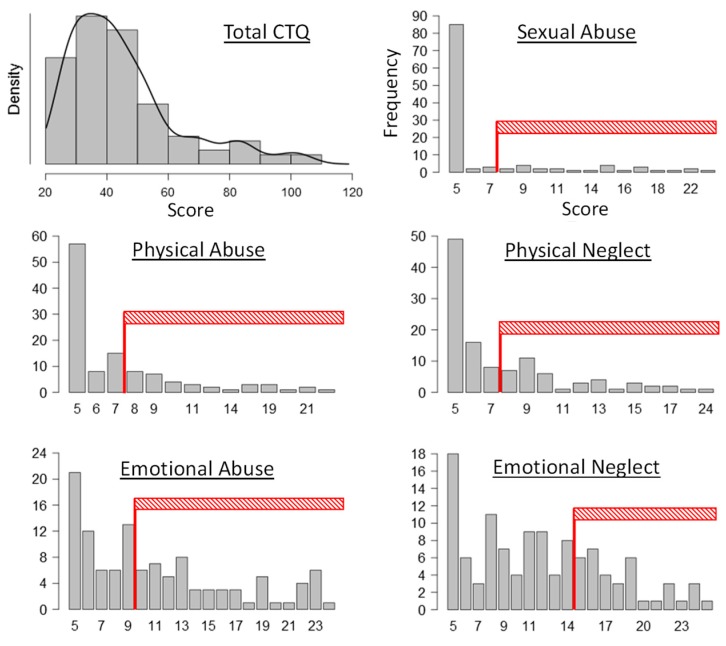
Figure A1.
Subject response distributions of total CTQ and CTQ subscales. Clinically significant maltreatment cut-offs for each of the subscales are indicated by the red shaded areas. The number and percentage of subjects are as displayed in Table A1. There is no cut-off available for total CTQ.

