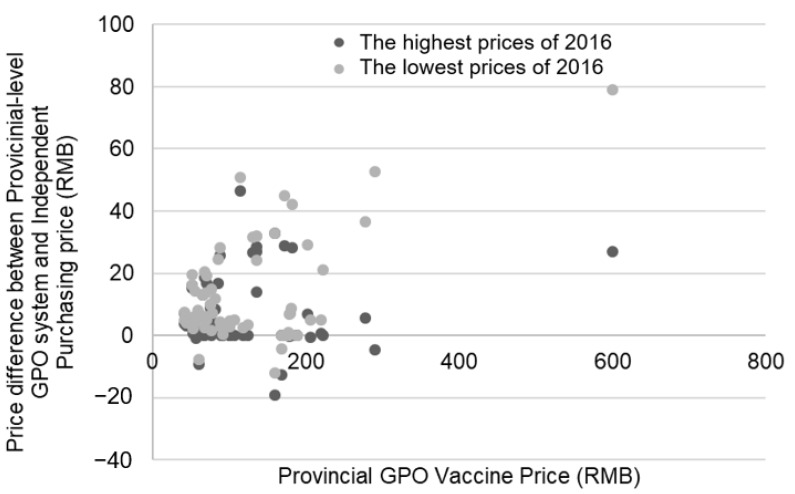
Figure 3.
Difference in prices between vaccines procured through the provincial GPO system and the difference between the provincial GPO system and the Independent Purchasing price. The darker dot represents the price difference between the highest prices of 2016 and the price in 2017. The lighter dot represents the price difference between the lowest prices of 2016 and the price in 2017.

