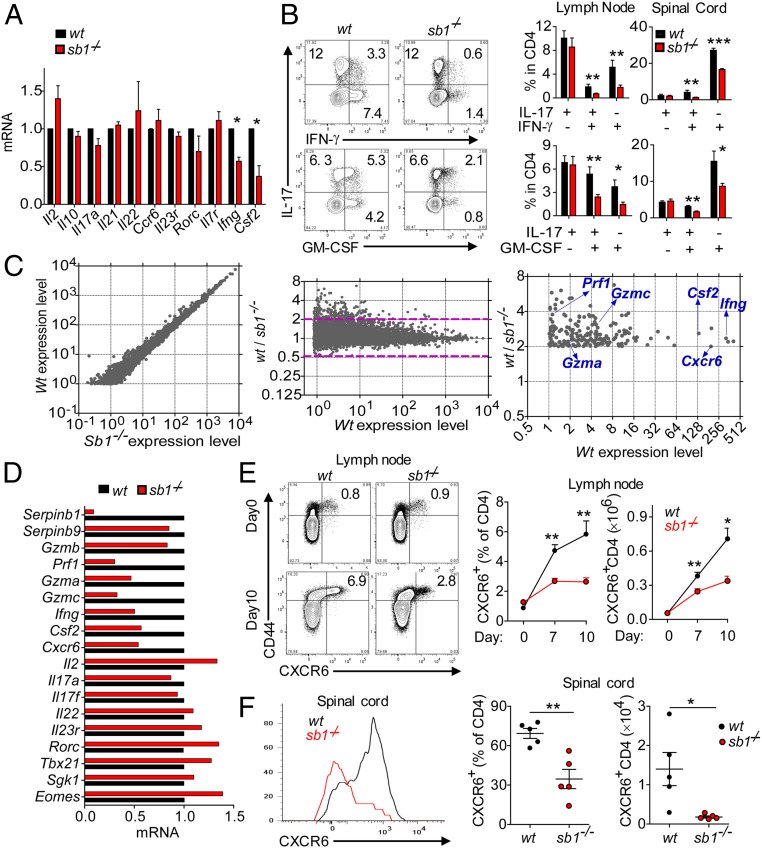
Fig. 3.
Decreased frequency of IFNγ+ and GM-CSF+ CD4 cells in LN of Sb1−/− mice provided the key to signature of pathogenic TH cells. (A and B) IFNγ+- and GM-CSF+ CD4 cells at the onset of EAE. (A) Relative gene expression of effector CD4 cells determined by qRT-PCR. Depicted data are mean ± SEM for pooled cells of 3 to 5 mice per genotype in three experiments. (B) Cytokine profiles analyzed by FACS. (Left) Representative contour plots of LN CD4 cells. (Right) Cumulative frequencies for LN and spinal cord CD4 cells. Data for 5 mice per genotype are representative of five experiments. (C) RNA-seq analysis. RNA of wt and Sb1−/− LN effector CD4 cells harvested at disease onset and incubated with P+I. Depicted (Left and Center) are the 9,650 genes with expression levels (FPKM) >1.0. Area above the dashed lines in Center depicts the 258 genes with Sb1−/− expression relative to wt decreased by >2.0-fold. Identities are indicated for the verified genes (Right). (D) Verification by qRT-PCR. Depicted data are representative of two cell isolates analyzed after P+I stimulation. (E and F) CXCR6 expression on CD4 cells of MOG-immunized wt and Sb1−/− mice. Depicted are representative plots (Left) and mean frequencies (Center) and absolute cell numbers (Right) for LNs at indicated days and spinal cord on day 14 (peak disease) (F). Data for 3 to 6 mice per time point per experiment are representative of two experiments. Symbols in F indicate individual mice; error bars represent ±SEM, *P < 0.05; **P < 0.01, ***P < 0.001 by Student’s t test.

