Fig. 7.
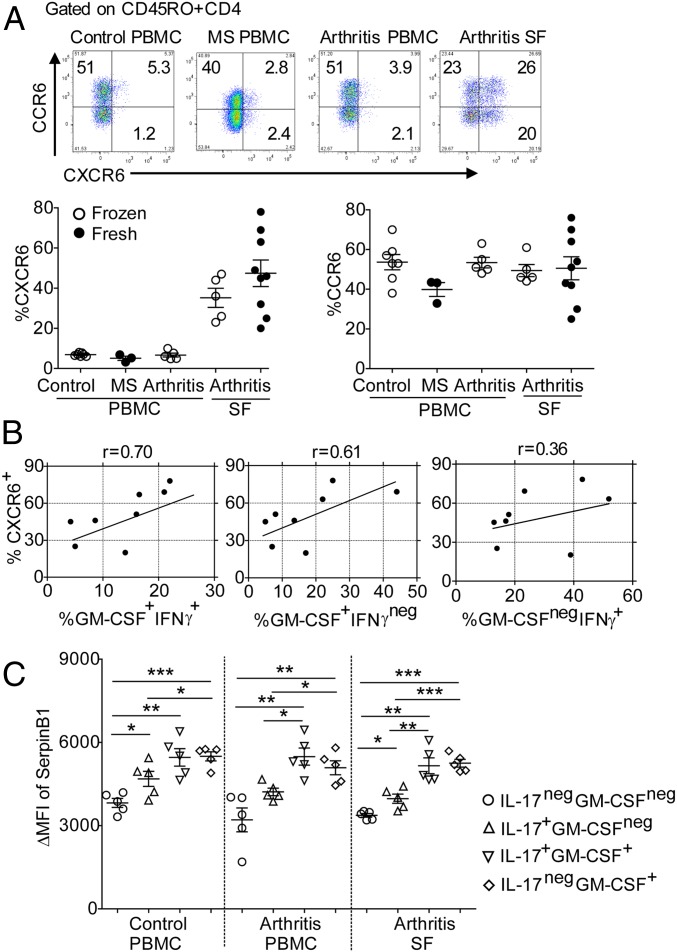
CXCR6, cytokines, and SerpinB1 expression in SF CD4 cells of patients with inflammatory arthritis. (A) CXCR6 and CCR6 expression: (Upper) Representative contour plots. (Lower Left) Cumulative frequencies of CXCR6+ cells in CD45RO+CD4 cells of peripheral blood of control individuals and MS patients and both peripheral blood and synovial fluid of inflammatory arthritis patients. (Lower Right) Cumulative frequencies of CCR6+ cells in the same populations. (B) Pearson’s correlation coefficients for frequency of CXCR6+ cells and indicated cytokine-expressing cells. Because the cytokine-producing cell incubation with P+I cause CXCR6 to be down-regulated, the results of separate assays were used to determine correlation coefficients. (C) Sb1 expression in the indicated cytokine-producing CD4 cells. Intracellular cytokines and Sb1 (clone ELA-5) were stained after 4-h stimulation with P+I and analyzed by FACS. Symbols indicate individual patients. *P < 0.05, **P < 0.01, ***P < 0.001 by Student’s t test.

