Fig. 2.
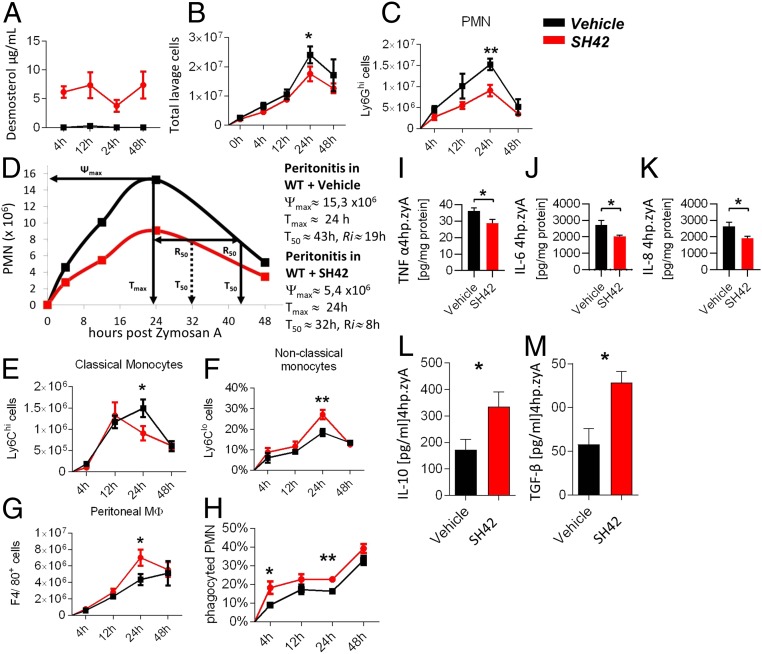
Peritoneal cell analysis. Red lines and circles represent SH42 treatment, and black lines and squares represent vehicle injection. C57BL/6 mice were exposed to zyA-induced peritonitis after 3 d of treatment with SH42, and peritoneal lavages were collected at 4, 12, 24, and 48 h. (A) Blood desmosterol levels after the indicated time points (x axis). (B) Total leukocytes were enumerated by light microscopy. (C) Cell numbers of PMN Ly6Ghi cells. (D) Ri values. Ψmax, maximum PMN numbers; Tmax, the time point of maximum PMN numbers; T50, the time point where PMN are reduced to 50%. (E) Cell numbers of classical Ly6Chi monocytes. (F) Cell numbers of nonclassical Ly6Clow monocytes. (G) Cell numbers of F4/80+ peritoneal MΦ. (H) Cell numbers of monocyte-derived MΦ efferocytosis as analyzed by FACS through intracellular staining of PMNs. (I) TNF-α analysis. (J) IL-6 analysis. (K) IL-8 analysis. (L and M) IL-10 and TGF-β levels all measured in the peritoneal fluids (4 h after zyA). The results represent at least 2 independent experiments and are expressed as mean ± SEM (n = 9 to 11 per group). All experiments were analyzed by means of an unpaired Student’s t test, 1 per time point. *P < 0.05; **P < 0.01. Further details are provided in the main text.

