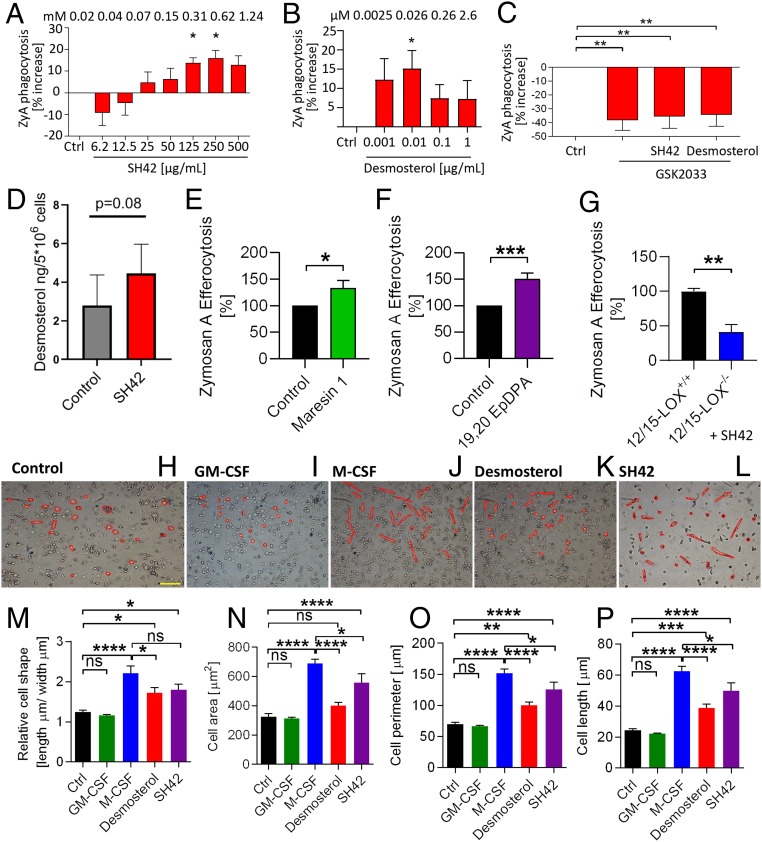
Fig. 8.
Functional studies of SH42, 19,20-EpDPA, and MaR1. (A) Phagocytosis under treatment with SH42. Ctrl, control. (B) Phagocytosis with desmosterol treatment. (C) Phagocytosis under cotreatment with GSK2033. Results in A–C represent at least 2 independent experiments and are expressed as mean ± SEM (n = 9 to 11 per group); 1-way ANOVA with Dunnett’s multiple comparison test. (D) Desmosterol analysis in SH42-treated MΦ (2 h); nonparametric Student’s t test. (E and F) Phagocytosis with MaR1 (E) and phagocytosis with 19,20-EpDPA (F) treatment. (G) Phagocytosis comparing wild-type and 12/15-LOX KO MΦ under treatment (both) with SH42. (E–G) Unpaired 2-tailed Student’s t test. Cell shape analysis of human PBMCs stimulated for 7 d with vehicle (H), GM-CSF (I), M-CSF (J), desmosterol (K), or SH42 (L) is shown. (Scale bar: 100 μm.) (M–P) Statistical analysis of cell shape, cell area, cell perimeter, and cell length (n = 3 to 11 independent experiments expressed as mean ± SEM). ns, not significant. (A–F and M–P) *P < 0.05, **P < 0.01, ***P < 0.001, ****P < 0.0001; 1-way ANOVA with Bonferroni correction. Detailed information about the experimental procedures used for cell shape analysis in H–L can be found in SI Appendix, S9.

