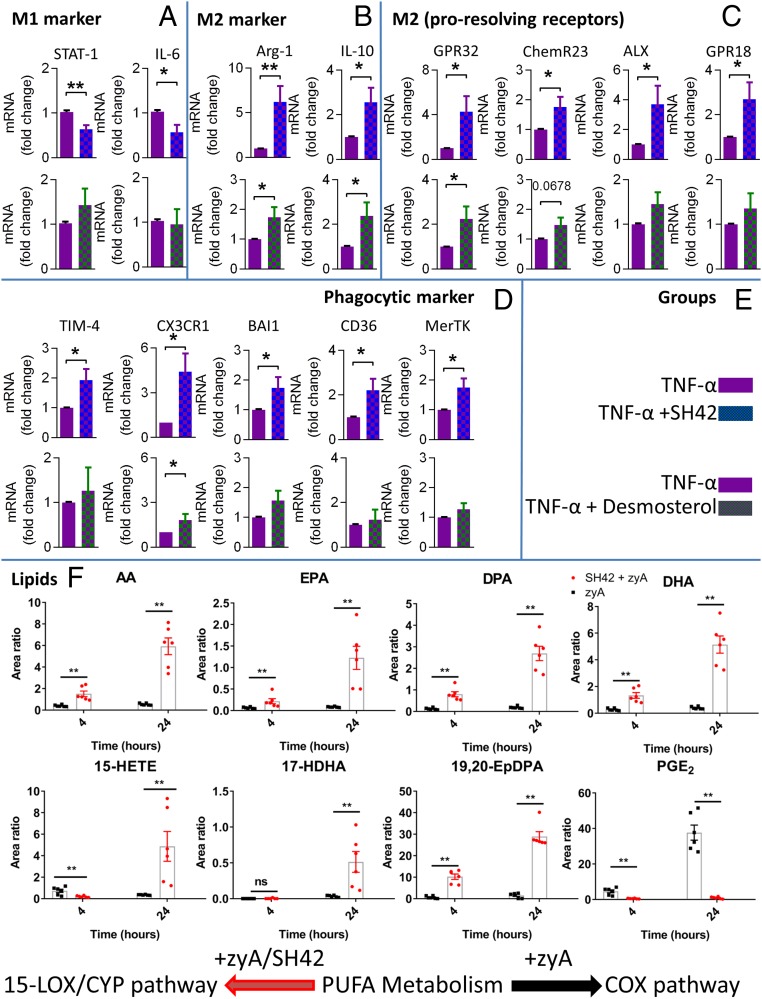
Fig. 9.
Analysis of MΦ phenotype and PUFA, 15-LOX, CYP, and COX pathway markers. M1 MΦ were stimulated with TNF-α and, in combination with SH42 or desmosterol gene expression, were analyzed for M1 markers (A), M2 markers (B), proresolving receptors (C), and phagocytic markers (D). (E) Groups are described; all mRNA levels were quantified by RT-PCR (n = 9 to 11). The results are representative of 3 to 11 independent experiments and are expressed as the mean ± SEM. *P < 0.05, **P < 0.01; unpaired 2-tailed Student’s t test. (F) LC-MS/MS analysis of PUFA, 15-LOX, CYP, and COX pathway markers (n = 6 for all experiments, with 3 biological replicates and 2 technical repeats; mean ± SEM). **P < 0.01, nonparametric Student’s t test (Mann–Whitney). ns, not significant.

