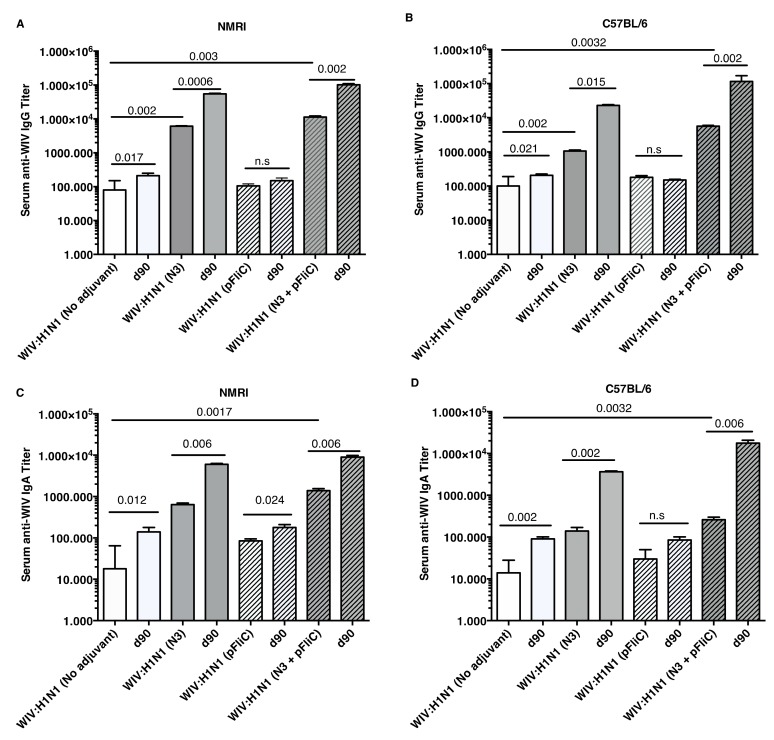
Figure 1.
Influenza A H1N1/WIV/SI specific serum IgG and IgA titers. NMRI mice (A) and C57BL/6 mice (B) IgG titers 3 weeks (day 21) after one immunization and 4 weeks (day 90) after the booster immunization shown for each group. Each bar shows geometric mean (GMT) serum titer, and error-bars show 95% confidence interval values for each study group. Influenza A H1N1 specific serum IgA titers in NMRI mice (C) and C57BL/6 mice (D) three weeks (day 21) after one immunization and four weeks (day 90) after the booster immunization shown for each group. Bars show geometric mean (GMT) serum titer, and error-bars show 95% confidence interval values for each study group. Significant differences are indicated by nonparametric Mann–Whitney U analysis p-values. n.s. = not significant.

