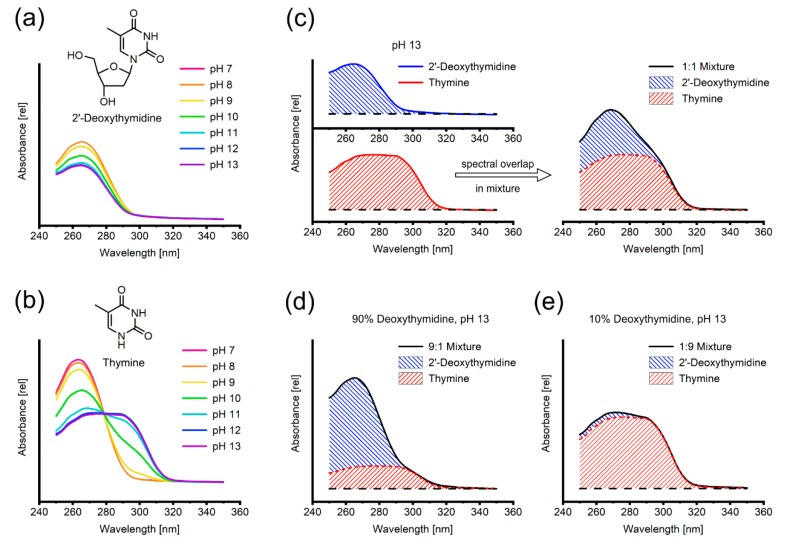
Figure 1.
(a,b) pH dependence of UV/Vis-absorption spectrum of 2’-deoxythymidine and thymine, respectively, between pH 7 (red) and pH 13 (purple). (c–e) Overlap of the individual spectra of 2’-deoxythymidine and thymine in mixture. The black line represents the experimental spectrum and the hatched areas are the contributions of thymine (red) and 2’-deoxythymidine (blue).

