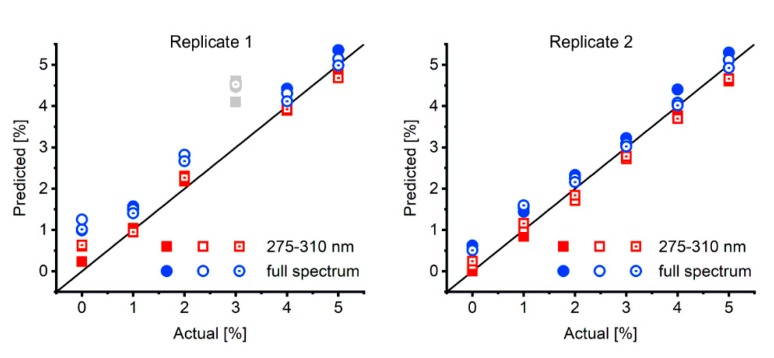
Figure 4.
Actual vs. predicted plots of 2’-deoxythymidine/thymine in the low percentage range (given values are molar fraction of the nucleobase). Two replicates of 0–5% thymine in 2’-deoxythymidine were prepared as 2 mM mixtures, measured three times (full, rimmed and rimmed with dot symbols) and fitted with either the full spectrum (blue circles, RMSD = 0.66 pp and RMSD = 0.36 pp for replicate 1 and 2, respectively) or from 275–310 nm (red squares, RMSD = 0.29 pp and RMSD = 0.24 pp for replicate 1 and 2, respectively). The outlier in replicate 1 is shown in grey and was not considered for RMSD calculation. pp: percentage points.

