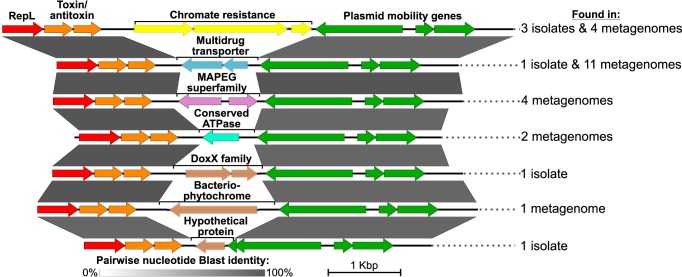
Fig. 2.
Linear representation of pLA6_12-like plasmids with different integration cassette motifs in isolates and environmental samples. Alignment visualization was produced using EasyFig. Pairwise Blast identities are indicated by gray shading showing a conserved backbone region. Only 1 representative is shown for each integration motif. The number of instances the motif was found in isolates and/or metagenomes is given on the Right. A detailed overview of all complete plasmid instances found for each integration motif is given in SI Appendix, Fig. S5.

