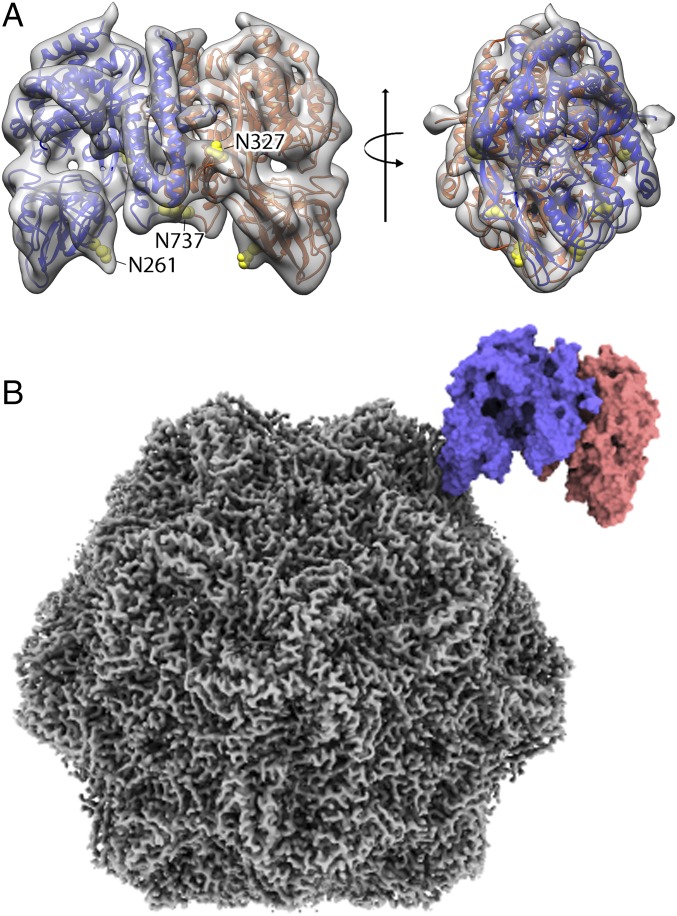
Fig. 6.
The localized reconstruction of the receptor density and fitted model identifying the TfR footprint on the CPV surface. (A) A 6.7-Å resolution cryo-EM density map for the bbj-TfR was generated by localized reconstruction image processing without symmetry. The intermediate resolution map was used to refine the bbj-TfR atomic model without the Tf bound. The TfR 3D map and model (with monomers colored in blue and red ribbons) were superimposed (A, Left) and rotated by 90° (A, Right). Three glycosylation sites with extra densities were shown by atoms in yellow spheres and labeled (A, Left). The local 3D map was surface rendered and colored transparent gray. The Tf density was removed to allow visualization. (B) The refined TfR model fitted into the asymmetric complex map. The sharpened map for CPV capsid (gray) and the fitted TfR model (blue and red) was surface rendered.

