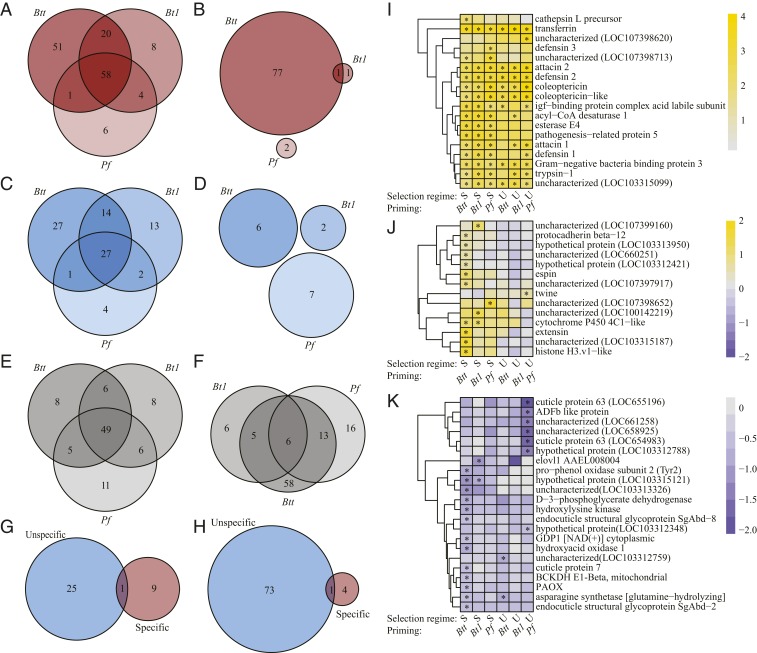
Fig. 3.
DEGs at 6 h after priming by selection treatment. (A–F) The number of DEGs at 6 h after priming compared to naive (i.e., unprimed) animals. (A) Specific treatment, up-regulated. (B) Specific treatment, down-regulated. (C) Unspecific treatment, up-regulated. (D) Unspecific treatment, down-regulated. (E) Untreated treatment, up-regulated. (F) Untreated treatment, down-regulated. (G and H) DEGs of naive (i.e., unprimed) animals of the specific and unspecific selection treatments compared with the untreated control treatment. (G) Up-regulated. (H) Down-regulated. (I–K) Heatmaps for selected genes that were significantly differentially regulated for at least 1 of the 6 selection/priming treatment combinations, indicated by asterisks. (I) Heatmap of the 10 most up-regulated genes for each treatment combination. (J) Heatmap of genes showing contrasting expression patterns among the treatment combinations. (K) Heatmap of the 10 most down-regulated genes for each treatment combination. For I–K, DEGs that are shared by treatments are shown only once.

