Figure 4.
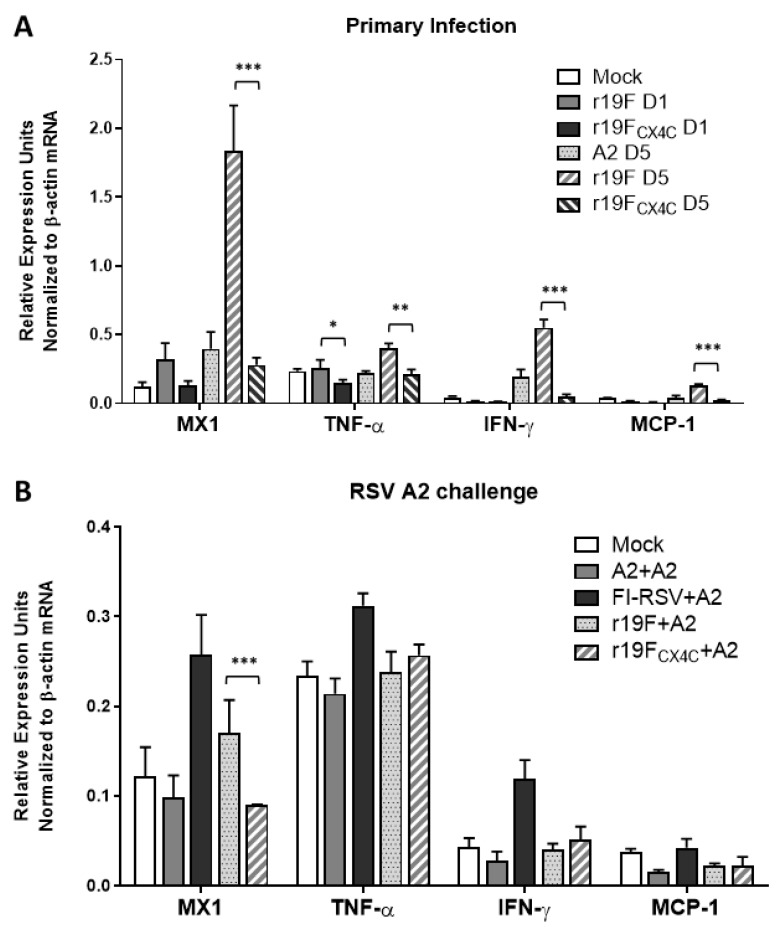
Cytokine/chemokine mRNA in lungs after primary infection (A) and day 5 post challenge (B) of cotton rats. RNAs were extracted from lung homogenates of infected animals at indicated time and reverse transcribed to cDNA. RT-PCR was performed in duplicates, and baseline cycles and cycle threshold (CT) were calculated. Relative quantitation of DNA was determined based on standard curve constructed by serially diluted cDNA of lungs from day 4 post infection of FI-RSV-immunized animals. CT values were shown as relative expression units normalized to the level of β-actin mRNA from same sample. Bars show mean values of mRNA ± SEM for all animals within a group. Statistical significance is indicated: *, p < 0.05; **, p ≤ 0.01; ***, p ≤ 0.001.

