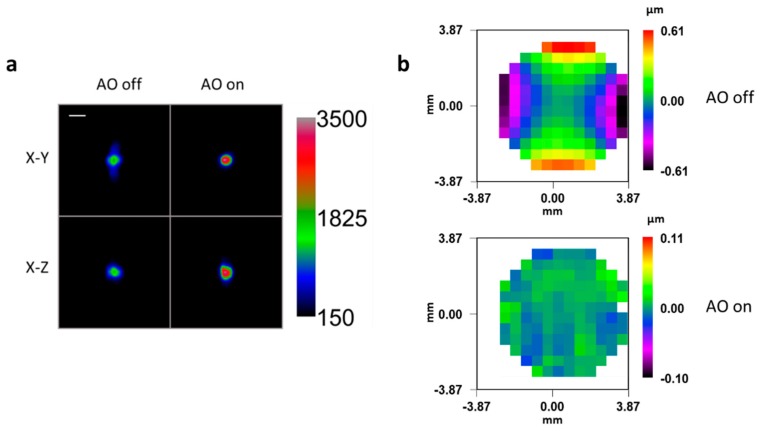
Figure 4.
(a) Maximum intensity projection of green fluorescent beads embedded in 1% agarose and imaged through a capillary glass at a depth of 100 µm, both before and after Adaptive Optics (AO) correction. Scale bar: 5 µm. Beads were illuminated with constant intensity at 491 nm. (b) Measured wavefronts before and after correction, offset by the reference wavefront corresponding to an aberration-free system.

