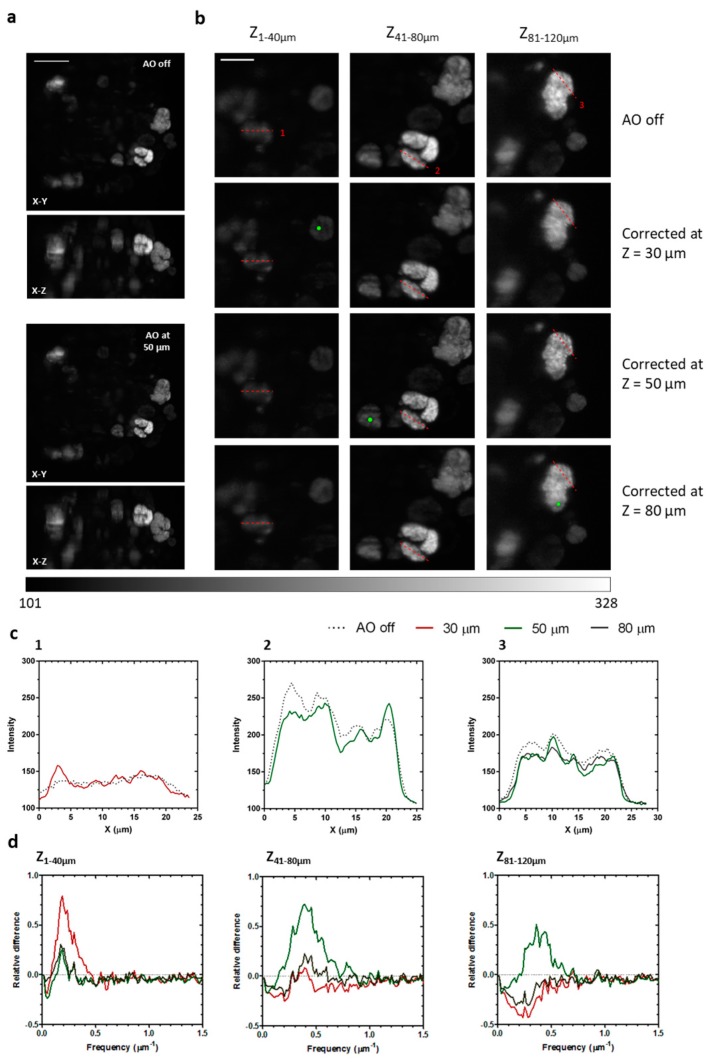
Figure 7.
Image quality improvement in depth. (a) Maximum intensity projection of MCTS expressing the fluorescent protein H2B-ArrestRed, before AOs correction and after correction at 50 µm. Scale bar: 50 µm. (b) Maximum intensity projections of three regions of interest before AOs correction and after correction at 30, 50, and 80 µm. NGS were placed at the green dot in the respective corrections. All images were acquired using the same excitation intensity and 100 ms exposure. Corrections were performed using 1 s exposures. Scale bar: 25 µm. (c) Intensity profiles along paths 1, 2, and 3. (d) Relative differences of spatial frequencies between each of the corrections and the uncorrected case for each region of interest.

