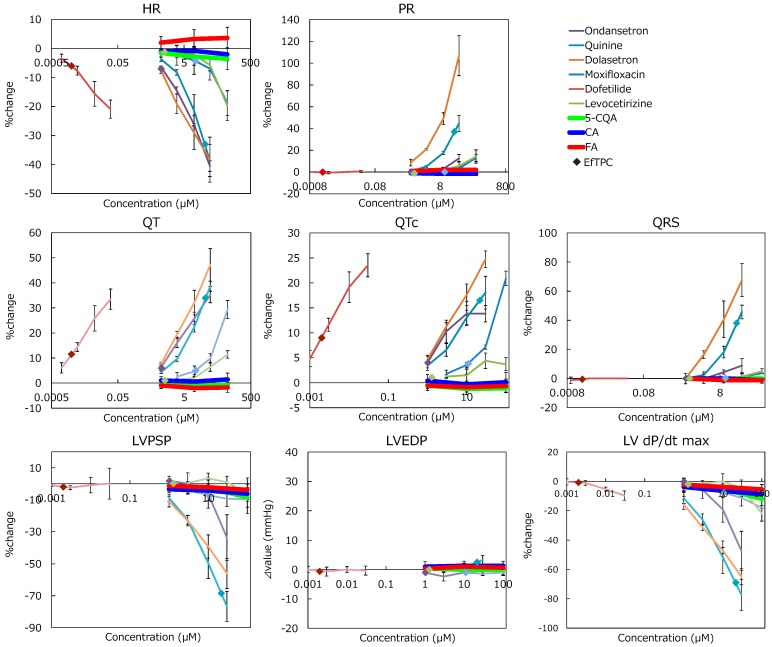
Figure 4.
Comparison between drugs with cardiovascular effects and chlorogenic acid (CGA) in the parameters of the Langendorff perfused heart assay. Each error bar represents mean ± SD (n = 3). ◆: depicts effective free therapeutic plasma concentration (color corresponds to each drug). CGA’s effect on each parameter was weaker than that of the drugs.

